Key Insights
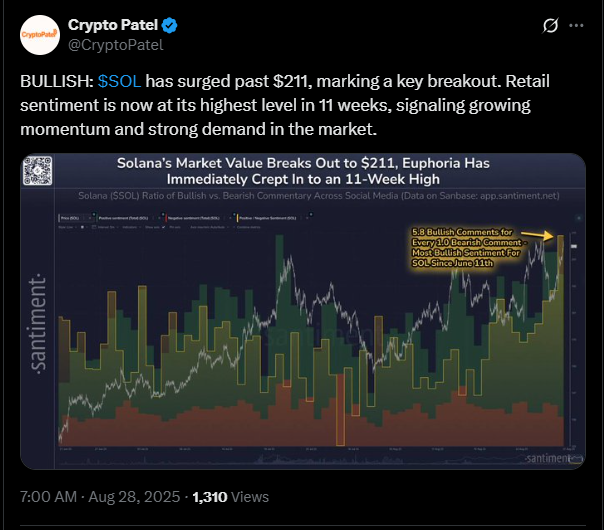
- Solana appears to be back in action and has just rallied past $200.
- Technical analysis shows resistance at $213 and possible upside toward $228 or even $255.
- Factors like the rising trading volumes, liquidations of shorts, and institutional interest keep Solana in the spotlight.
Solana price has recently broken above the $200 price level for the first time since early August. This bullish strength surge is due to technical strength and other factors.
Over the past two months, Solana has climbed more than 37%. The latest push above $200 has confirmed its summer rally. It also raises the question of whether the token can break through the following resistance levels.
Solana Price Technical Levels to Watch
The charts show that Solana price action as of writing looks solid. Over the last two weeks, the token crossed major milestones. This includes the 23.6% Fibonacci retracement at $199.57 and the 30-day SMA at $182.09.
Indicators also back the bullishness, according to the charts. The MACD, for example, shows a bullish crossover. On the other hand, the Relative Strength Index (RSI) is sitting around neutral levels near 55.
This means that Solana can climb further without moving into overbought territory. The short-term outlook for the asset also shows $213 as the next significant resistance. If Solana closes above that level, traders are eyeing $228 as the next target.
Conversely, support now rests near $196 and even deeper at $185. This means that these levels could be retested if the price fails to consolidate above $200.
Altcoin Rotation Keeps Solana in Focus
As of this writing, Bitcoin trades at around $110,000, and Ethereum is hovering around $4,700. Due to this outlook, traders are now moving capital into altcoins like Solana.
Investors are shifting their focus toward more volatile tokens. These assets offer more substantial short-term upside potential. The rotation reflects growing risk appetite in the market.
Open interest in crypto perpetuals has now climbed to $936 billion, supporting this trend. Solana, in particular, has benefited from this rotation. Also, traders are piling into futures and spot positions to capture as much value as possible.
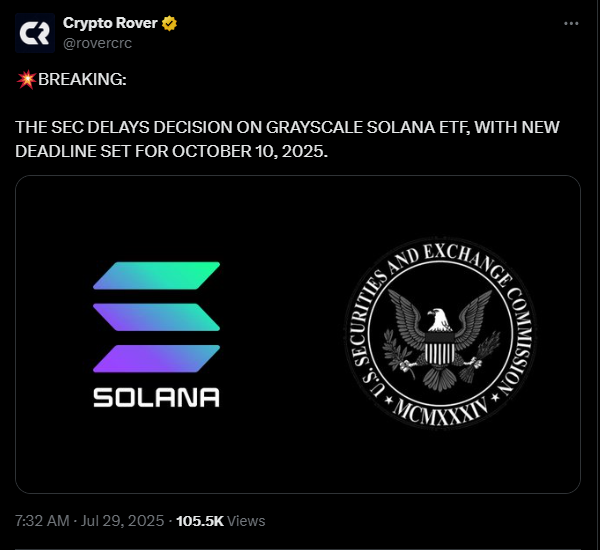
However, there is currently one headwind in play. The US SEC has delayed decisions on several altcoin ETF filings until October.
Bitcoin and Ethereum ETFs are already attracting billions in institutional flows. However, Solana is still awaiting approval that could unlock a new wave of demand.
Short Liquidations Add Fuel to the Rally
Data from Coinglass shows that Solana investors recently got hit with a wave of short liquidations as Solana crossed above $200. More than $754,000 in short positions were also cleared, compared to $638,000 in longs.
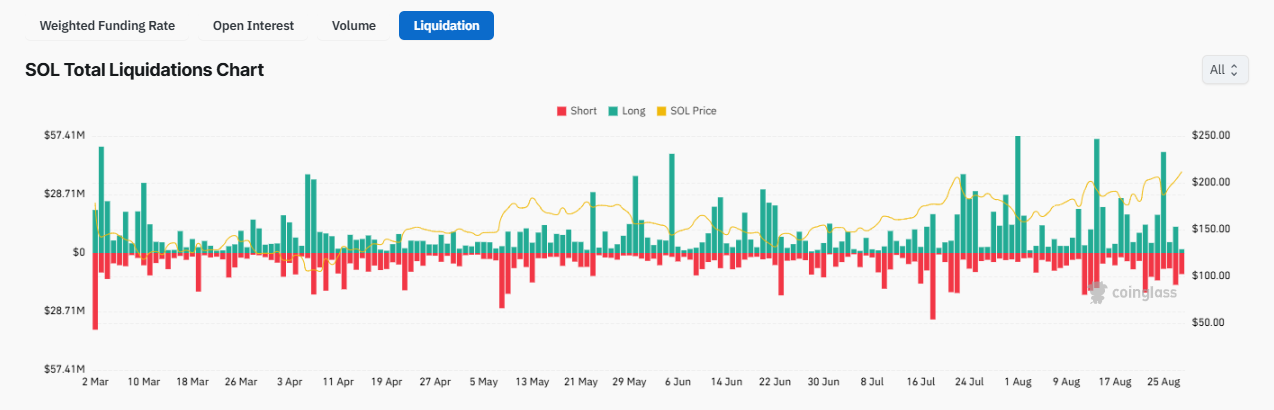
Exchanges like Hyperliquid and Bybit saw the heaviest liquidations. This shows how many traders had bet against Solana at significant resistance levels. Now that those positions have been forced out, the path to higher ground will likely become easier for bulls.
Analysts See Solana Targeting $213 and Beyond.
Market analysts are still divided on how high Solana can climb in this rally. However, most agree that $213 is the closest battleground. Crypto analyst Lark Davis pointed out that Solana has been rejected thrice at $205.
The higher lows and buying pressure have caused a breakout above this zone. However, the $255 zone is the next strongest technical target.
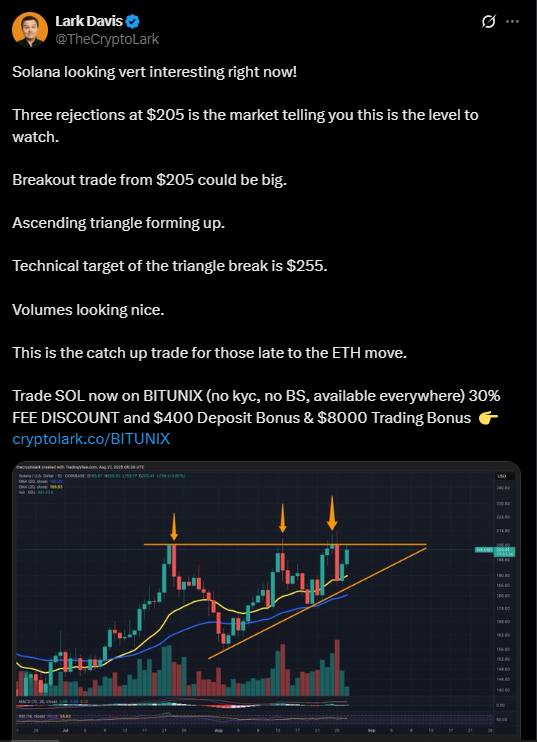
Other analysts agree that trading volume supports this view. Solana’s daily trading volume has surged more than 45% to over $12 billion. This would mean that investors are packing funds into the asset and are betting on further increase.
Technical Indicators Support Stability
More than price action, indicators are still showing strength. According to the daily charts, the MACD histogram has flipped positive and confirms strength in favour of the bulls.
The RSI remains neutral-bullish at 55 to 58. This leaves room for further upside before hitting overbought conditions.
On-chain signals look good, too. Trading volume is rising steadily, and Solana rebounds strongly from its ascending trendline. These clean recoveries show active buying every time the price dips, further strengthening the bullish case.