Key Insights
- SEI is holding firm above an important support and is showing signs of strength.
- Analysts are pointing towards resistance between $0.40 and $0.45 as the next major hurdle.
- A breakout could set up SEI for highs near $0.60 and possibly even $0.65.
SEI has bounced strongly from support levels and is now moving into a “make it or break it” price zone. Analysts are now eyeing resistance levels ahead, and the question is whether SEI can maintain its standing and push toward higher price targets.
The asset currently trades near the $0.30 range and is trending between support at $0.25–$0.26 and resistance at $0.40–$0.45.
This zone will determine the token’s next major move. If buyers can push through resistance, analysts believe that targets at $0.60 and even $0.65 may come into play.
Higher Low Shows Strength in SEI Price
One of the most interesting signals for SEI is the formation of a higher low around $0.2161. This structure has historically marked the beginning of uptrends and has been attracting interest from traders.
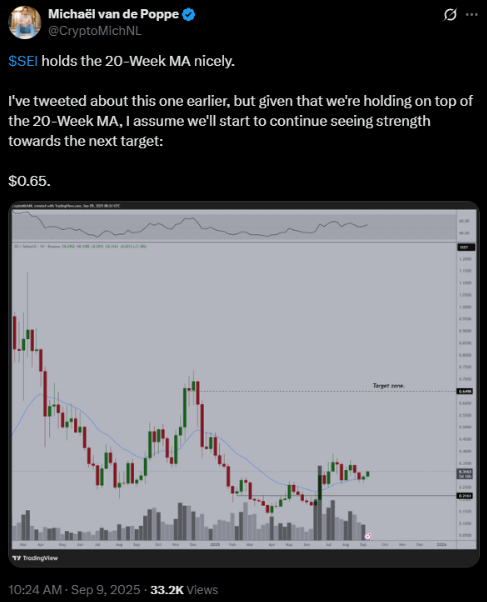
Well-followed analyst Michaël van de Poppe pointed to this setup as a bullish signal. According to details of a recent post, he noted that SEI could climb more than 100% if it can clear the resistance zone near $0.40.
Van de Poppe noted that Sei is trading above its 20-week EMA, which is a majorly bullish signal as well.
If this resistance clearing above $0.40 occurs, the resulting upside could place targets at $0.5686 and ultimately $0.60.
At the same time, traders are keeping a close eye on the downside. If SEI loses support at $0.25, a return to the $0.21 area becomes likely.
This makes the current price range a very important zone for both bulls and bears.
Technical Outlook Favours Bulls
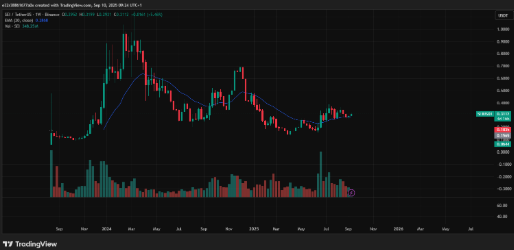
SEI is also showing strength on longer timeframes. The token has held above its 20-week moving average, as mentioned by van de Poppe. This dynamic support has acted as a reliable base and is reinforcing confidence among traders.
Strong demand has shown up around $0.216, and is giving SEI a foundation that has held despite multiple tests. On the upside, $0.65 is viewed as the next major resistance zone.
This said, a breakout toward this level would represent nearly a 100% gain from current prices.
Volume analysis also supports the bullish case. Accumulation patterns indicate that both retail and institutional investors are pitching their tents ahead of an incoming rally.
This kind of behaviour tends to come before sharp price moves towards the upside.
Risks of a Bearish Pattern
Not all signals are looking upward, though. Some analysts have noted the presence of a possible head and shoulders formation on SEI’s daily chart. This pattern tends to indicate bearish strength and could usher in a reversal if confirmed.
As of writing, SEI is trading below both its 9-day EMA and 50-day SMA. This is a sign of short-term weakness, despite its position above the 20-week EMA.
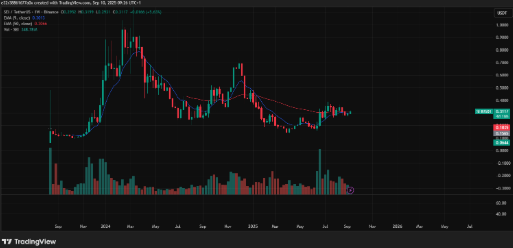
This said, if the neckline of the pattern breaks, SEI could retrace toward $0.22–$0.20. However, if buyers step in strongly, a bounce back to $0.30–$0.32 remains possible.
This means traders should be on the lookout. The next few sessions could decide whether the bearish pattern plays out or gets invalidated by fresh buying pressure.
Outlook for SEI Price
SEI is currently trading at a turning point. Its resilience at support levels and formation of a higher low give the bulls reason to be optimistic.
A breakout above $0.40 would likely speed things up faster and bring the $0.60–$0.65 targets within reach.
However, there are a few risks to be aware of. A breakdown below $0.25 could hand the steering wheel back to the bears. For now, though, SEI’s price depends heavily on its ability to hold support and clear resistance.