Key Insights
- Solana price recently formed a golden cross, alongside a cup-and-handle pattern, which are both highly bullish.
- Analysts are now eyeing the $240 – $248 zones as a target if resistance at $187.74 is broken.
- Despite bullish technicals, funding rates, and DEX activity, sentiment is currently cautious.
Solana price has entered a critical phase. It is now flashing two important bullish technical patterns on its daily chart. According to recent data from TradingView, a golden cross and a cup-and-handle formation are now in play for SOL.
This is creating strong technical support for a possible rally. That means traders watch as the Solana price inches towards important resistance levels.
Golden Cross Points to Higher Solana Price
The last time SOL formed a golden cross was in October of last year. When this happened, the event was followed by a near 50% rally over three months. This could mean that if history repeats, the Solana price could reach $240 in the next few months.
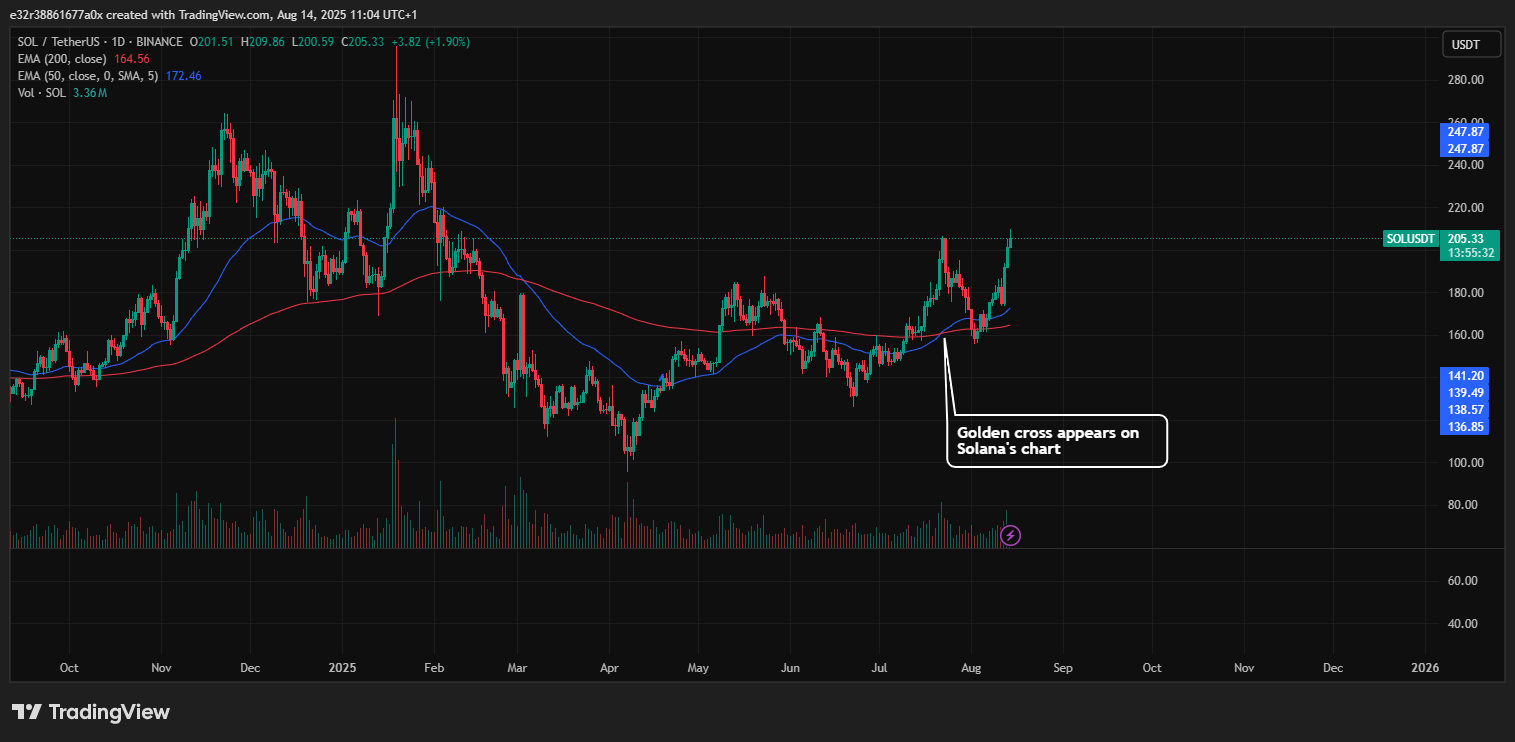
For some context, a golden cross occurs when the 50-day simple moving average moves above the 200-day moving average. This crossover tends to signal the start of a longer-term uptrend.
At a time when institutional interest is expanding and altcoin market activity is surging on-chain, Solana’s golden cross is very notable. Many traders believe this is a bullish trigger that could increase prices.
Based on historical performance, Solana price could be on the verge of an upward push before the end of August.
Cup-and-Handle Adds to Bullish Case for Solana Price
Alongside the golden cross, the SOL chart has formed a cup-and-handle pattern. Historically speaking, this pattern typically shows a continuation of an uptrend after a period of consolidation.
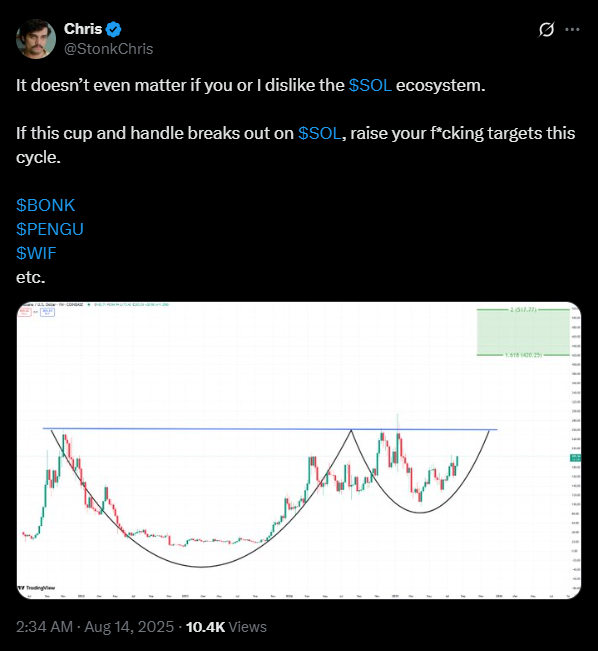
Analyst Chris drew attention to this formation. A chart depicts the cup’s base at the Solana price of $126.40 and a neckline resistance at $187.74.
The depth of the cup indicates that a possible 48% move towards the upside could be in play if a breakout occurs. This shows a potential upside target of around $248, slightly higher than the golden cross prediction.
When two bullish patterns appear together (as is the case), it often indicates a stronger breakout probability. Traders usually see this as confirmation to hold or add to their positions.
Support Levels and Risks
Despite the positive setup, there are certain price levels that SOL must hold to continue upwards. According to the charts, this price level for SOL is $156, or the lower edge of the handle in the pattern.
In other words, a drop below this point could invalidate the bullish predictions and lead to a deeper correction. Market sentiment across the wider crypto sector, regulatory changes, or strong moves in Bitcoin’s price could also influence SOL’s movements.
Futures Market Shows Cautious Optimism
SOL perpetual futures funding rates currently sit at an annualised 12% according to data from Coinglas. This sits right on the border between neutral and bullish sentiment.
At the same time, it shows some optimism. It is far from the overly aggressive setups seen during previous Solana frenzies.
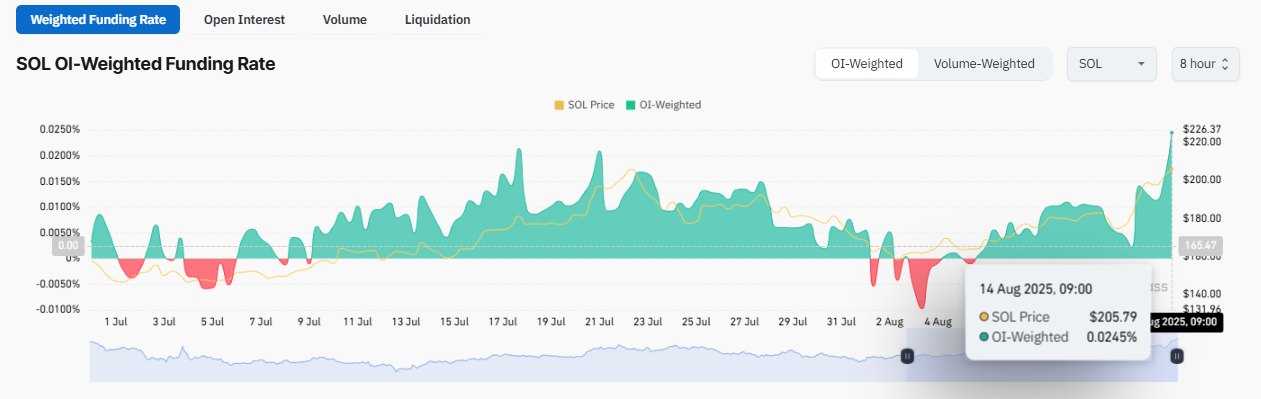
This isn’t bad news, though. It shows that a rally will be as healthy as possible when a rally occurs. When market prices rally without unreasonable long positions, the risk of sudden liquidations is lower.
This could be good for stability over the long term. Put, leverage is under control. For now, at least.
DEX Volumes Reflect Slower Activity
Another area of concern for Solana is its DEX volumes. Data from DefiLlama shows that the weekly DEX volumes have fallen for the third consecutive week to around $15.6 billion.
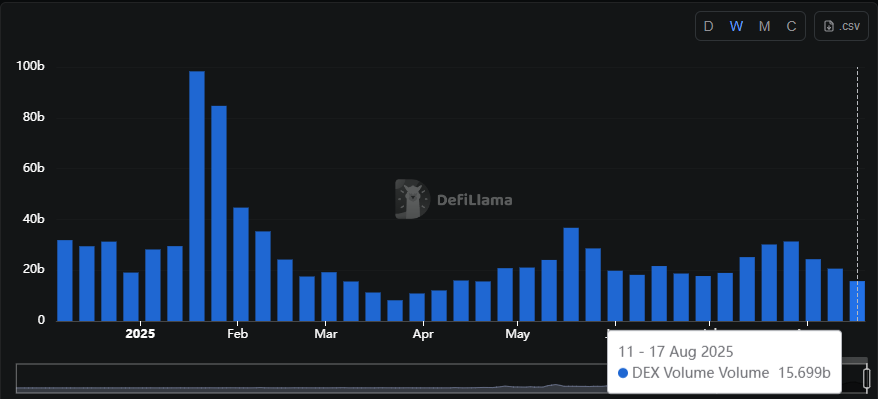
Over the last 30 days, Solana processed $113.7 billion in DEX trades. This is just under Ethereum’s $116.2 billion. However, this comparison does not account for Ethereum’s layer-2 activity.
This added another $91.7 billion in the same period. In summary, the Solana price is in a strong position from any angle. It is more poised for a sustained rally than an unreasonably overheated one.