Key Insights
- The BTC price has climbed above $122,000 lately and is now approaching its all-time high.
- The rising M2 money supply may be one of the biggest sources of demand for scarce assets like Bitcoin.
- Institutional buying and Bitcoin breaking out of major resistance zones could be major sources of strength to BTC’s rally.
BTC has surged past $122,000 lately, which has put the asset within reach of its all-time high.
The interesting aspect of this rally is that it comes just as new data shows that the M2 money supply is growing in major economies like the US.
This combination of macroeconomics and market demand has been a major source of strength for the world’s largest cryptocurrency.
What are some interesting things to know as the correlation between the M2 and BTC strengthens and traders eye $140,000?
BTC and the Expanding M2 Money Supply
Think of the M2 money supply as a measurement of the total amount of money in circulation. This includes cash, checking deposits, and easily convertible assets.
Over the past year, this metric has continued to rise and is supported by the improving monetary policy and fiscal measures in several countries.
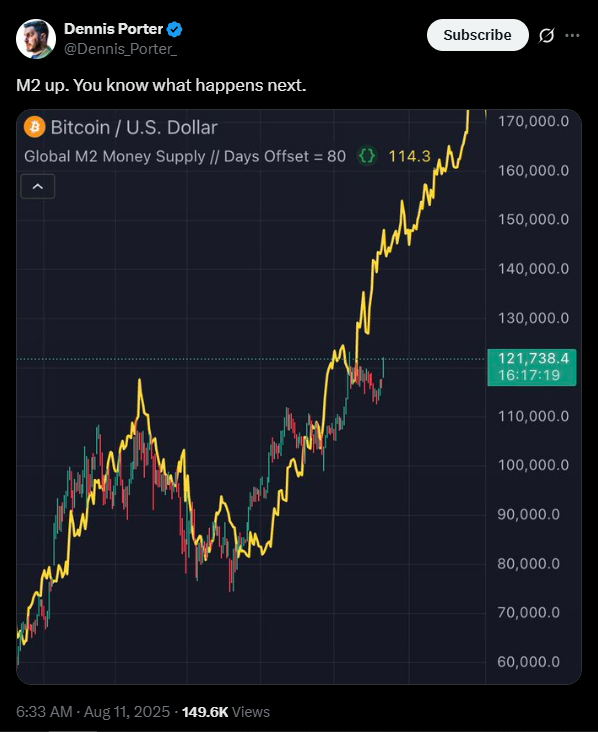
When more money is available, issues with currency devaluation tend to be on the rise. Because of this, BTC (with its fixed supply of 21 million coins) is regarded as a hedge.
In essence, when the money supply rises, Bitcoin tends to follow as more investors take their wealth digital to protect its value.
Notably, while money supply data alone cannot determine what Bitcoin’s price does, it could be one of the biggest factors in the ongoing rally.
Institutional Activity Has Been Another Driver
While Bitcoin has been soaring, institutions are now increasing their BTC positions. Treasury rebalancing has been on the rise after the recent regulatory clarity in the US.
Analysts are also pointing to a recent executive order that encouraged ETF inflows in the US for 401(k) accounts.
On-chain data support the ongoing rise in Bitcoin’s price, because it shows reduced BTC reserves on exchanges.
This is a sign that long-term holders are accumulating rather than selling. This tightening supply on the open market can also do much to add to upward price pressure.
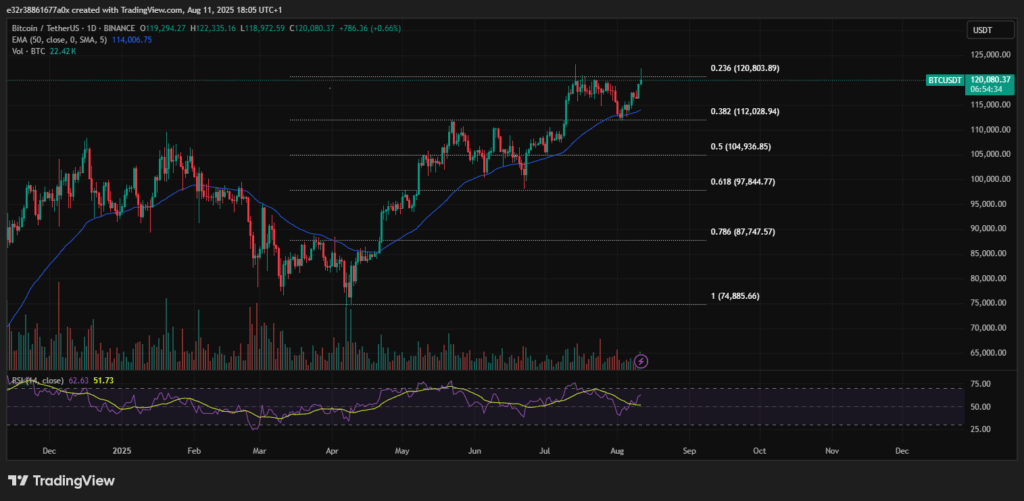
The BTC Technical Outlook
As of writing, BTC is currently challenging the 1.618 Fibonacci extension level near $122,000. This is a mathematically important resistance zone that has held back rallies in the past.
In other words, a daily close above $120,000 would be a milestone for BTC, as it would open the door to further resistance ahead.
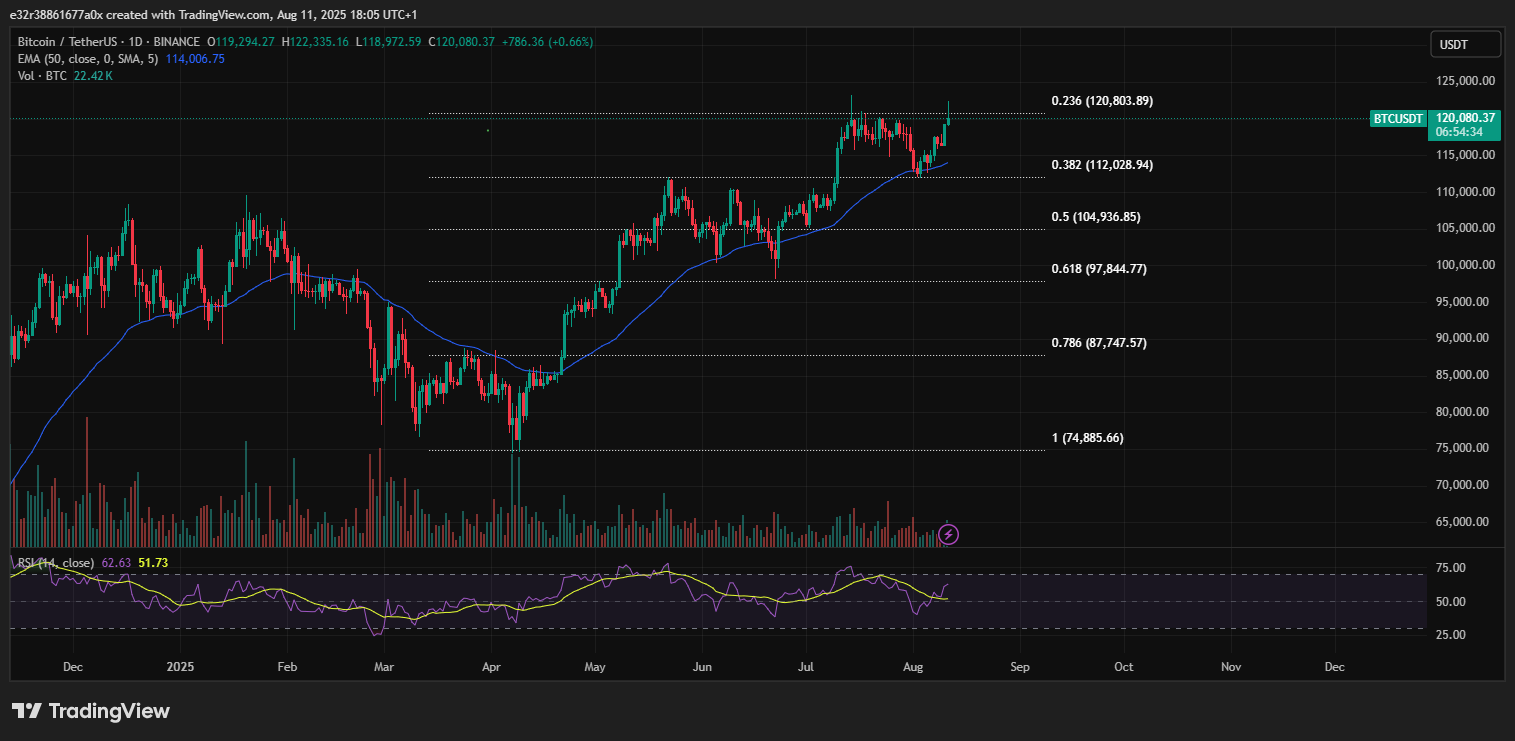
Analysts are generally targeting resistance levels like $127,000 at the 61.8% Fibonacci extension from the recent trend and $137,000 at the 100% extension.
Finally, the $153,000 at the 161.8% extension serves as the major resistance for BTC, where profit-taking is most likely to occur.
Several major banks and analysts expect BTC to reach $150,000 or higher by Q4 or early next year if the ongoing rise in prices continues
Market Data Shows Strong Fundamentals
BTC’s market cap stands at $2.33 trillion, with 24-hour trading volume around $14.38 billion.
This shows that institutional interest is strong for the cryptocurrency, and the ongoing rally is fueled by institutional interest rather than short-term speculation.
So what should investors watch out for this week?
The relationship between BTC and the M2 money supply is still under debate, but evidence shows a correlation between the two.
Analysts are on the lookout for faster liquidity or new monetary easing that could reinforce the bullish case.
At the same time, traders are also watching for a confirmed breakout above $122,00, as well as any daily candle closes above $120,000.