Key Insights
- Bitcoin price has been holding above $111,000 despite heavy whale selling pressure.
- Analysts are eyeing the $100,000 zone as a major bounce level if prices dip.
- Fibonacci retracement indicates a maximum 10% decline before recovery.
Bitcoin’s price has been showing strength above the $111,000 level, even after the largest whale sell-off since mid-2022.
Traders and analysts now agree that $100,000 stands as the most important support zone in the near term. If Bitcoin were to retest that level, historical patterns show that it would act as a logical rebound area.
Where Bitcoin Currently is as of September 8th, 2025
Recent data from TradingView shows Bitcoin gaining around 1% in daily trading to close the week at $111,369.
This came after a dip triggered by U.S. macroeconomic data, but buyers defended the $110,000 mark.
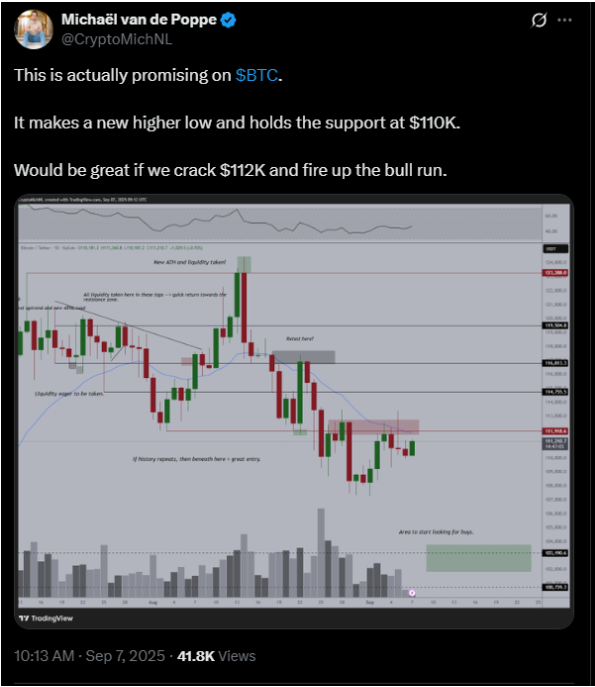
Crypto trader Michaël van de Poppe pointed out the strength of the support zone and mentioned that a push above $112,000 could restart the bullish momentum.
Other traders, however, warned that failure to hold resistance around $112,000 to $113,000 could send prices back to $100,000.
Why $100,000 is Important for Bitcoin Price
The $100,000 region is not only a psychological zone, it is also a technical one. Traders are watching the 200-day simple moving average (SMA), which currently sits near $101,760 as a support level.
A drop toward this level would still be consistent with previous retracements.
This said, Fibonacci retracement levels add some strength to this outlook. Historically, Bitcoin has found bottoms around the 0.382 Fibonacci level. Based on current price action, that lines up well with the $100,000 zone.
According to trader ZYN, this means the “worst case scenario” would be a 10% pullback before Bitcoin attempts a push toward $150,000.
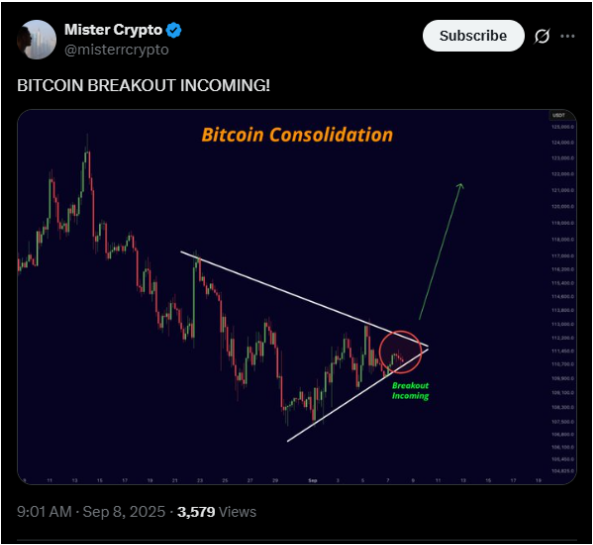
Analyst Mister Crypto also shared the same outlook in a similar post, noting that Bitcoin was trading within a symmetric triangle and could be looking at a breakout towards the upside.
Most notably, the 0.382 Fibonacci retracement has repeatedly marked bottoms for Bitcoin in previous cycles. This indicates that a correction to $100,000 could set the stage for a major rally.
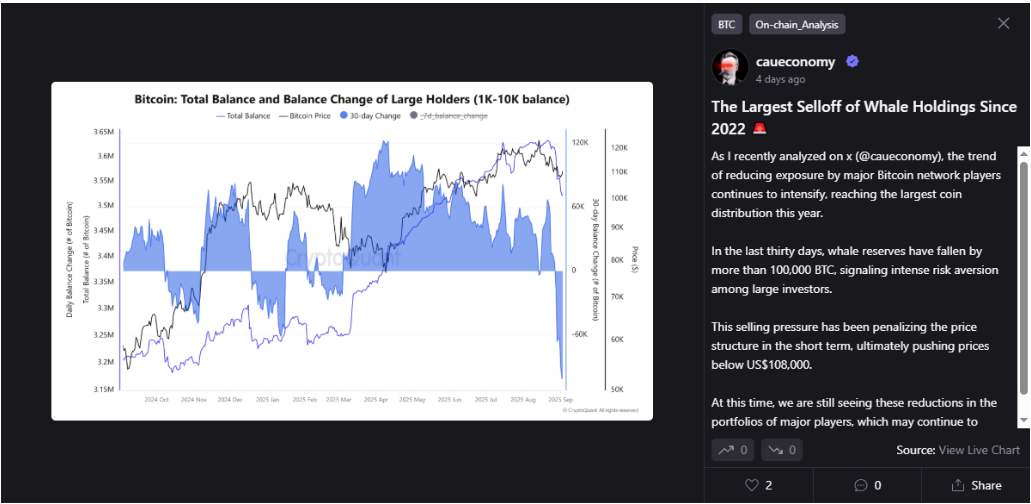
Bitcoin Whales Trigger $12.7 Billion Sell-Off
While technical charts are showing signs of a possible recovery, whale activity has added downward pressure to the mix.
Data from CryptoQuant shows that whales sold more than 115,000 BTC in the last 30 days. For context, this haul is equal to around $12.7 Billion. This was the largest monthly sell-off since July 2022.
Such selling forced prices below $108,000 at one point, and created volatility/short-term liquidations. Analysts believe that the sell-off shows risk aversion among large investors.
Overall, even though the sell-off was intense, data shows that the pace has cooled.
Whale balance changes dropped from 95,000 BTC in early September to around 38,000 BTC by September 6. This indicates that the worst of the pressure may be easing.
Institutional Demand Balances Whale Selling
Despite the heavy whale activity, Bitcoin’s price has held steady within a range of $110,000 to $111,000 for several days. Analysts believe that this stability is coming from institutional buying, especially from companies and Bitcoin ETFs that continue to accumulate.
At the end of the day, Bitcoin’s ongoing trend looks healthier compared to previous cycles. The asset has only corrected about 13% from its mid-August all-time high, which is shallower than many past pullbacks.
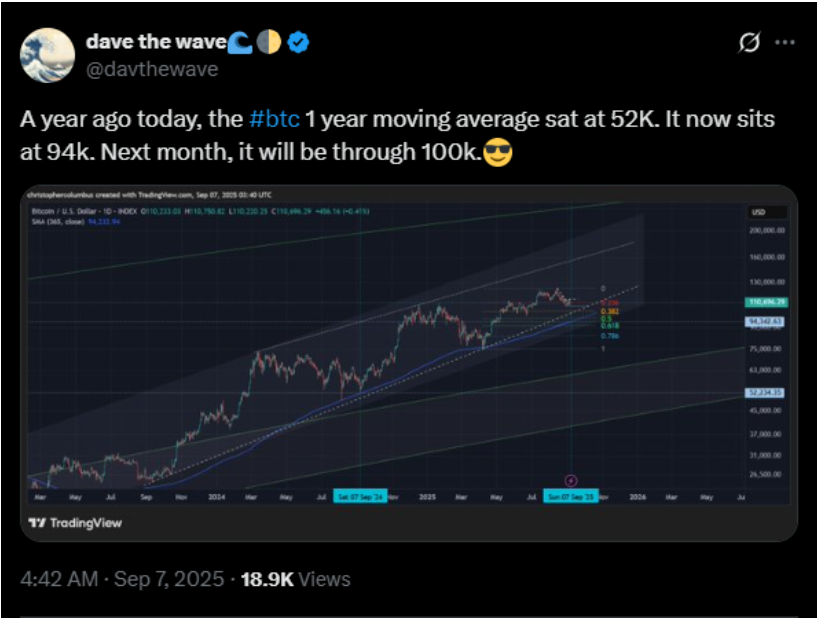
Analyst Dave the Wave pointed out that Bitcoin’s one-year moving average has climbed from $52,000 a year ago to $94,000 today. He also noted that by next week, the moving average is expected to break $100,000.
This steady growth shows a strong long-term trend, even if short-term fluctuations continue to be intense.