Key Insights
- Dogecoin Price has formed a double bottom pattern on the daily chart, aiming for $0.50.
- There is an ongoing rise in network activity, and whale accumulation could add to bullish traction.
- Primary resistance levels at $0.30 and $0.40 could determine the next prices.
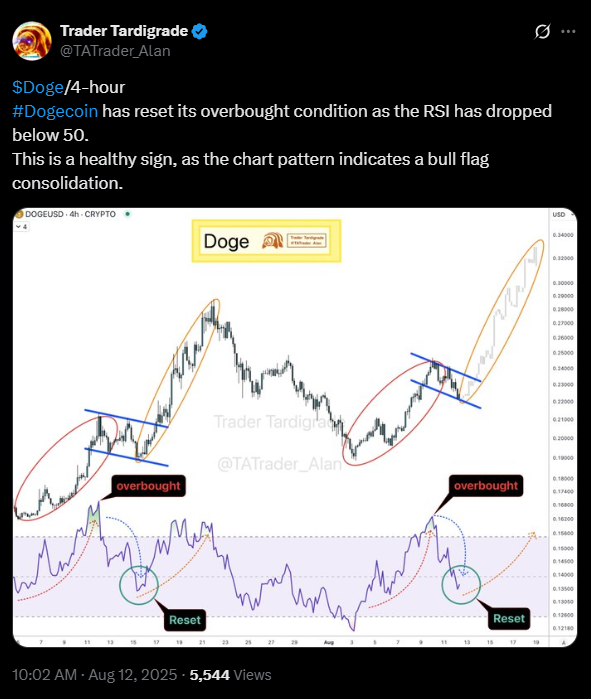
Dogecoin Price flashes a bullish reversal signal after weeks of sideways movement. According to technical analysis from analyst Trader Tardigrade, DOGE is forming a double bottom pattern. This was recorded on the daily chart with a possible upside target of $0.50.
Double Bottom Signals Potential Surge for Dogecoin Price Toward $0.50
According to Trader Tardigrade’s outlook, this setup is a classic signal that selling pressure may weaken. The analyst may turn out to be right. If this happens, the Dogecoin price could be on the verge of fresh buying interest from traders and long-term holders.
DOGE trades above $0.22 and has a daily trading volume in the billions. Because of this, the market is watching to see if the pattern breaks upward with strong volume support.
The double bottom formation pointed out by the analyst resembles the letter “W.” It tends to come after the end of a downtrend. Historically, it forms when price tests a significant support level twice before rebounding.
In DOGE’s case, the lows have been tested around the same price zone twice, which explains this structure. A breakout above the neckline, especially with higher volume, would confirm the pattern.
If confirmed, technical predictions put the Dogecoin Price near the $0.50 mark. That would represent more than a 100% gain from current price levels.
Dogecoin Price Faces Key Resistance Before $0.50 Breakout
Before reaching the $0.50 target, DOGE must clear two important resistance levels. The first sits near $0.30, while a stronger zone around $0.40 follows the second.
Historically, DOGE has experienced strong rallies once these levels are broken. In past bull cycles, similar trade setups led to surges of over 100% in days.
However, traders are advised to watch trading volumes. When breakouts happen with low volumes, they typically turn out to be fake moves and can lead to strong pullbacks.
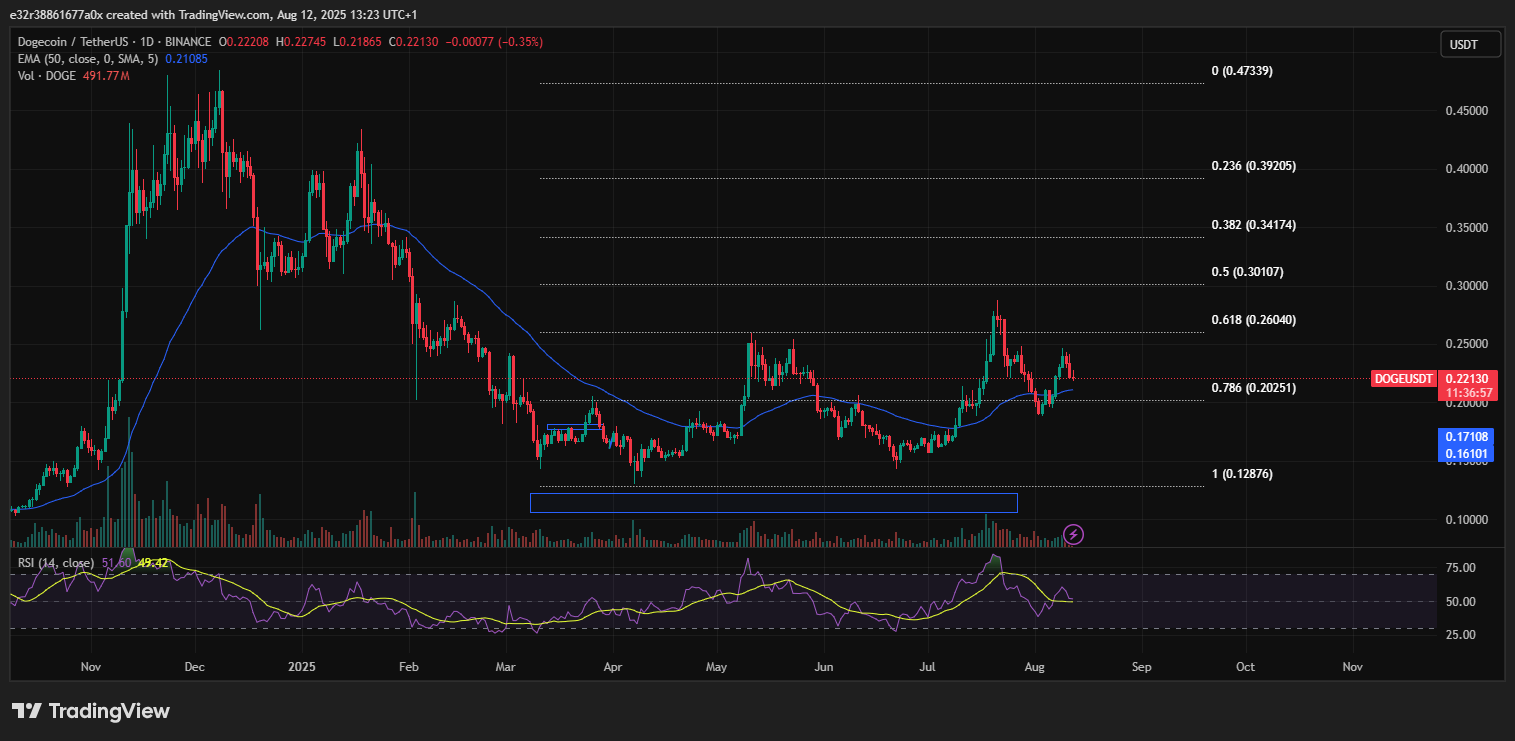
Meanwhile, the Relative Strength Index (RSI) is nearing the 50 mark on the daily chart. In other words, a move above this level could confirm fresh strength for DOGE.
Moving averages also support this narrative. The hourly chart, for example, shows the 200 EMA holding as a strong support zone.
On-chain data showed that there has been a surge in transaction volumes. With this, the DOGE/USDT pair sees over $500 million in trading activity. Dogecoin price is known for having a strong correlation to Bitcoin.
This said, the sentiment across the market has mostly been positive. If Bitcoin crosses the $122,000 price level, DOGE could be next.
Short-Term Trading Opportunities
The double bottom pattern could be a major opportunity source for spot and futures traders. Leverage trading on DOGE/BTC and DOGE/USDT pairs could offer stronger returns if the breakout on Dogecoin price holds.
Aggressive traders might take partial profits at $0.35 while holding positions for a possible run to $0.50. More cautious traders, on the other hand, could place stop-loss orders just below the neckline to limit their downside risk.
While the technical setup is strong, the $0.50 target is still a long way up. This means that DOGE will need stronger volumes and further market strength to maintain its standing.
Immediate support sits at $0.20, with deeper support near $0.10 if sentiment turns bearish. Traders should look for a strong daily close above the chart pattern’s neckline.
A volume spike of over 1 billion DOGE daily adds credibility to the breakout. Together, these two signals help confirm that the price move is real and not a false breakout.