Key Insights
- SEI has seen eight straight weeks of exchange outflows, which shows that it has substantial accumulation.
- Prices have been sluggish despite a bullish 100-day/200-day EMA crossover.
- Analysts see $0.3 as a buy zone, with $0.35–$0.37 as key resistance levels.
SEI has been holding steady near the $0.3 price level. This comes despite a bullish crossover between two key EMAs on its chart.
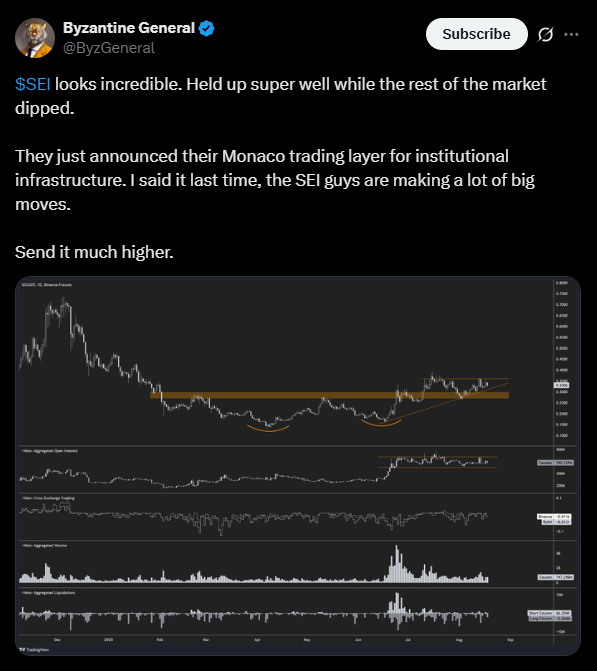
Despite the general market being shaky lately, SEI has been resilient. It has gained more than 45% in three months, amid a 6.3% in the past week.
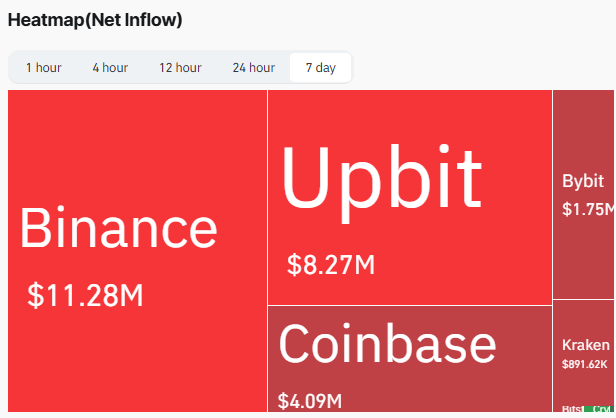
SEI Exchange Outflows
According to data from Coinglass, SEI’s net flows have been negative over the last week. The previous seven days alone saw $11.28M withdrawn from Binance.
This trend comes in as the second-largest weekly outflow since July’s peak. Moreover, despite slow prices, such steady moves tend to show buying pressure and long-term conviction among holders.
This comes amid the recent launch of Sei’s Monaco. It’s a Wall Street-grade trading layer designed for institutional use. The CBOE also recently filed for a Canary Staked SEI ETF.
Both developments have shown rising interest in SEI from larger investors.
On-chain activity also backs this trend. According to Santiment, active addresses have risen by nearly 8,000% since the project’s launch. Also, DefiLlama data shows that the network’s Total Value Locked (TVL) is close to $626 million.
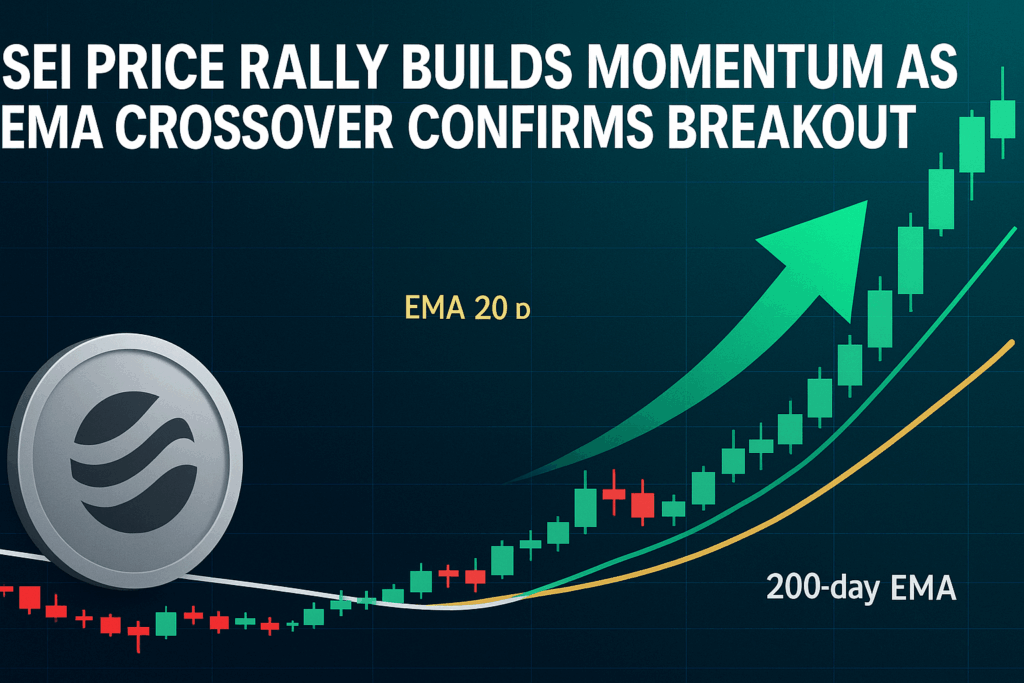
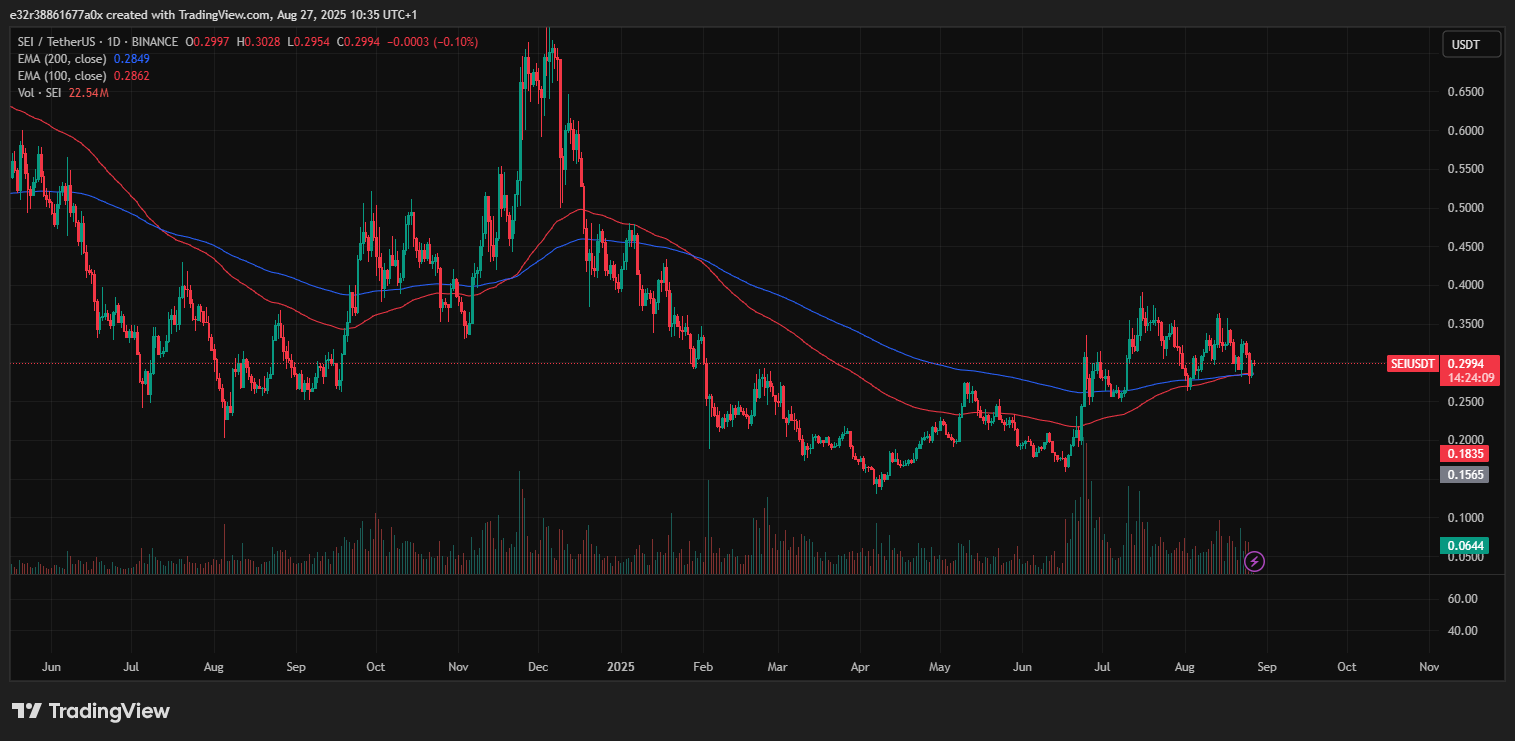
SEI Price Rally Supported by Bullish EMA Crossover
One primary reason for the rising optimism is the technical signals from the charts. According to the daily chart, the 100-day EMA has just exceeded the 200-day EMA. This trend is known as a bullish cross, and traders see this pattern as a bullish confirmation.
Swing traders often use the EMA crossover to validate a medium-term uptrend. It is also worth noting that a 100-day/200-day crossover is rare and usually shows stronger market conviction.
At the same time, short sellers are increasing their exposure. Over the past week, Bitget alone recorded $37.34 million in new shorts against SEI. This is compared to $26.15 million in long positions.
SEI Price Levels to Watch
SEI is trading near $0.3 and holding just above local support at $0.29. The levels between $0.25 and $0.3 have repeatedly acted as a buy zone for bullish traders.
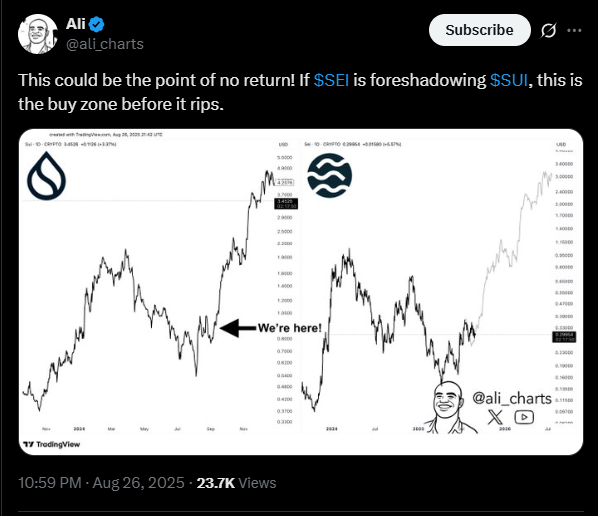
Analyst Ali Martinez recently noted that SEI is mirroring Sui’s price behavior from late last year. He believes SEI could be “foreshadowing” a similar rally, based on comparable chart patterns and momentum indicators.
If this trend holds up, the cryptocurrency could reach $0.35 in the medium term. If Sei breaks above the $0.35 price level, the $0.37 will open up before $0.42.
It is also worth noting that the $0.35 price level is a historically strong resistance level. Regardless, a clean break above $0.35 would shake the market structure in favour of bulls. It would open the path toward higher highs.
Institutional Interest Pushes SEI Into Spotlight
The combination of Monaco’s launch and the CBOE’s ETF filing has given SEI strength in terms of market position. Monaco can handle large-scale trading while providing support for RWAs.
This means the Sei Network has a natural edge over competitors, focusing mainly on smaller DeFi activity. Analysts like Byzantine General note that SEI’s stability during the general market’s weakness has boosted confidence among traders.
Still, there are a few risks. If SEI falls below $0.29, the short-term bullish setup may weaken. This would give shorts temporary relief before the bulls look to reload positions. SEI isn’t showing strength in every sense, but its stability is intact.