


Ethereum (ETH) is trading near a pivotal support zone around $2,000 as of February 28, 2026, navigating through broader market volatility and shifting sentiment. This analysis examines the data-driven signals from price action, derivatives markets, on-chain metrics, and technical structure to assess whether ETH is poised for stabilization or further downside.
Current Market State: ETH Near $2,000 Support
As of February 27, 2026, Ethereum was trading around $2,047, reflecting a cautious tone across the crypto market. By February 28, broader risk-off sentiment had intensified, with Bitcoin slipping and ETH holding near the $2,000 mark.
February price history shows ETH began the month around $2,269 and declined approximately 18.7%, closing near $1,993 by mid-February. This places the current level at a critical support zone, where previous bounces occurred and where technical and psychological thresholds converge.
Market Structure: Derivatives Point to Deleveraging
Derivatives data reveals a sharp contraction in leverage and open interest. Over the past 30 days, ETH futures open interest dropped by approximately 80 million ETH, with Binance alone seeing a 40 million ETH decline. Funding rates have plunged into deeply negative territory—the lowest since early 2022—indicating extreme bearish positioning and potential for a short squeeze if sentiment shifts.
Exchange reserves have also declined to around 16.3 million ETH, a multi-year low. This suggests reduced sell-side pressure and growing accumulation via staking or off-exchange custody.
Coinbase Institutional commentary notes that funding rates for ETH have normalized from deeply negative levels to neutral, signaling a reset in leverage rather than renewed bullish aggression.
On-Chain Evidence: Supply Tightens, Accumulation Grows
The drop in exchange reserves to 16.3 million ETH underscores a tightening of tradable supply, often associated with accumulation and reduced selling pressure.
While detailed metrics like active addresses or SOPR are not available in recent reports, the combination of reduced open interest, negative funding, and low exchange reserves suggests that long-term holders may be accumulating during this dip, while leveraged traders are de-risking.
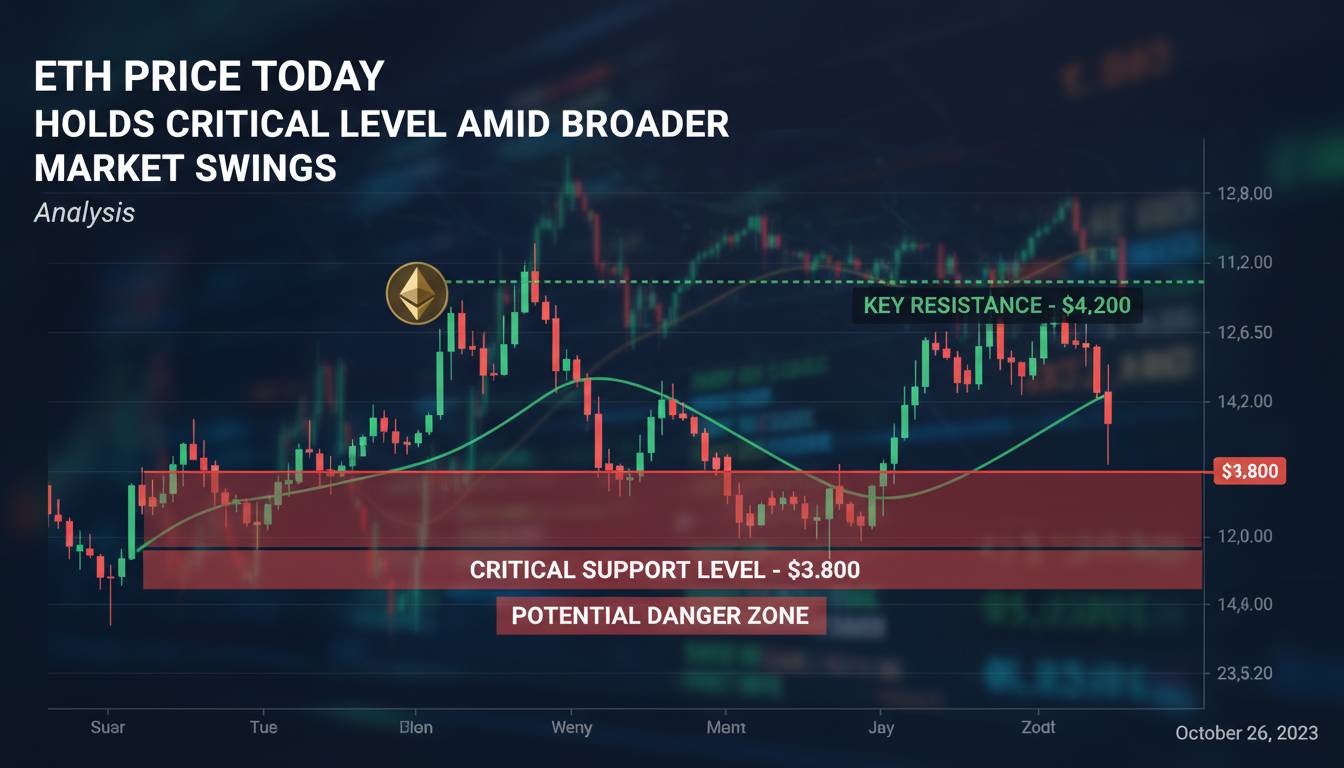
Technical Structure: $2,000 as a Key Battleground
Technical analysis highlights the $1,965–$2,000 zone as a critical resistance-turned-support area. ETH is currently testing this level, which aligns with the 23.6% Fibonacci retracement and a psychological threshold.
Further resistance lies at $2,100–$2,188, with stronger barriers at $2,388–$2,400 (descending triangle resistance) and $2,690–$2,800 (50-day EMA zone). A breakout above $3,000—where the 100-day and 200-day EMAs converge—would be required to signal a sustained trend reversal.
Critical Analysis: Is ETH Building a Base or Breaking Down?
The convergence of data suggests ETH is at a critical juncture:
- Derivatives markets show extreme bearish positioning and deleveraging, which historically precedes short squeezes if sentiment shifts.
- On-chain metrics indicate accumulation and reduced supply, supporting the case for stabilization.
- Technical structure places ETH at a key support zone that, if held, could anchor a recovery.
However, risks remain. If macro sentiment deteriorates or technical support fails, ETH could break below $2,000 and test lower levels such as $1,740–$1,760 or even $1,400, as some analysts have warned.
Conversely, a rebound above $2,100–$2,188 with volume could pave the way toward $2,400 and beyond, though a sustained rally would likely require broader market improvement.
Forward Context: What Could Shift the Balance?
- Macro catalysts: A shift in risk sentiment—driven by equity markets, Fed policy, or geopolitical developments—could either reinforce support or trigger further downside.
- Derivatives dynamics: Continued negative funding and low open interest may set the stage for a short squeeze if bullish momentum returns.
- On-chain developments: Any uptick in staking, institutional accumulation, or network activity could reinforce the base-building thesis.
- Technical breakout: A decisive move above $2,100–$2,188 with volume would be the first step toward reclaiming higher resistance zones.
Disclaimer: This article is for informational purposes only and does not constitute financial or investment advice. Cryptocurrency investments carry significant risk, including the possibility of total loss. Past performance does not guarantee future results. Always conduct your own research and consult a qualified financial advisor before making investment decisions.


Leave a comment