


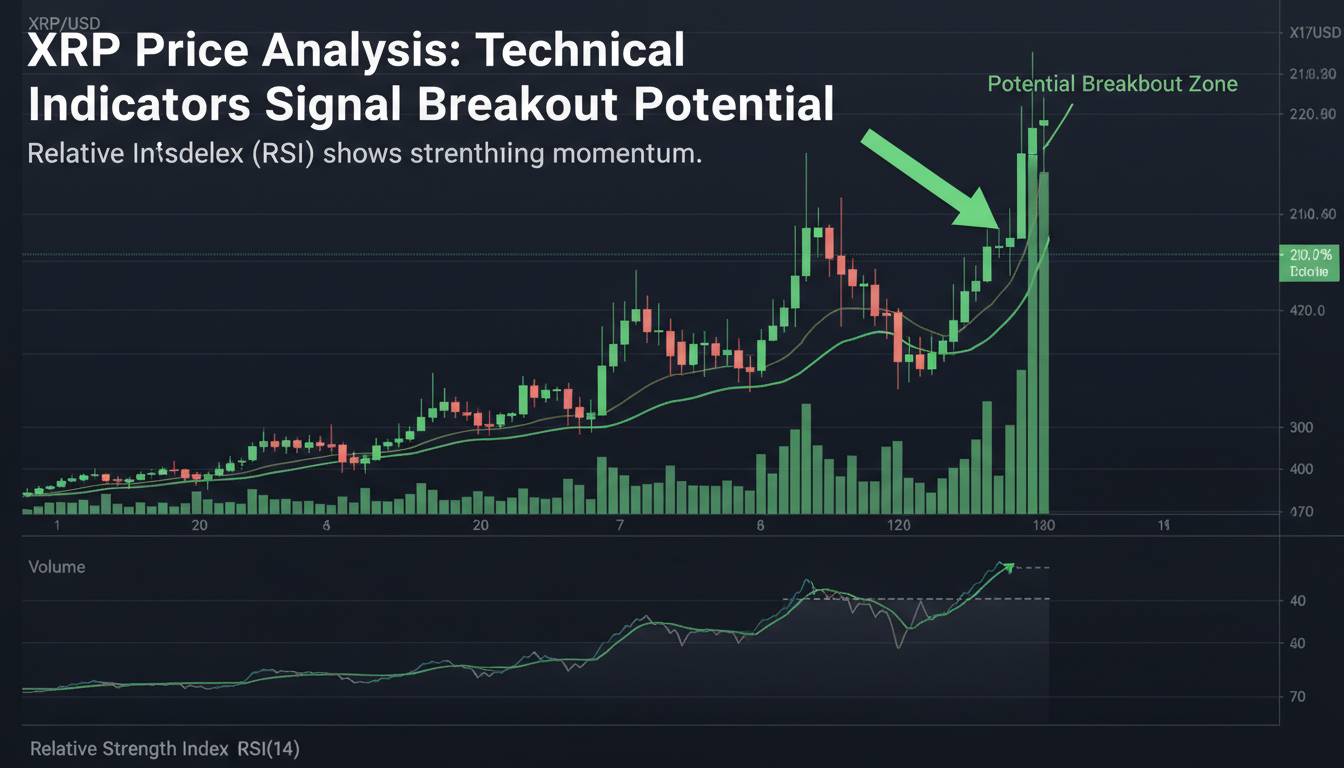
XRP is showing signs of a potential breakout, with technical indicators and on-chain metrics aligning to suggest a shift from consolidation to upward momentum. As of mid-February 2026, XRP trades around $1.52, having recently broken above the $1.50–$1.55 resistance zone—a move that could pave the way for further gains if sustained on strong volume .
Current Market State: Break Above $1.50–$1.55 Resistance
XRP’s recent breach of the $1.50–$1.55 resistance zone marks a notable shift in its short-term trajectory. The token is trading at approximately $1.52, with 24-hour trading volume reaching $2.29 billion, though this remains below early February levels of $5.5 billion . This breakout suggests growing bullish conviction, but the relatively subdued volume indicates that broader market participation has yet to fully materialize.
The price remains significantly below its July 2025 peak of $3.65, reflecting a broader bearish structure characterized by lower highs and lower lows on the weekly timeframe .
Market Structure: Funding Rates and Active Addresses Signal Reversal Potential
On-chain metrics reinforce the technical setup. The Binance perpetual funding rate has dropped to a 10-month low of –0.028%, signaling an extremely crowded short position—a setup that has historically preceded sharp reversals . Simultaneously, active addresses have surged past key thresholds that have historically preceded sustained rallies, suggesting accumulation by long-term holders despite recent price weakness .
These signals point to a potential shift in market sentiment, with short-sellers possibly being squeezed and long-term holders stepping in to accumulate.
Technical Indicators: RSI, MACD, and Moving Averages
Momentum indicators present a nuanced picture. The daily RSI remains in the 32–38.8 range—below the neutral midpoint of 50—indicating limited bullish momentum despite a recovery from deeply oversold conditions . The MACD histogram hovers near zero, suggesting a neutral-to-slightly bullish bias .
On the moving average front, XRP remains above its 50-day MA (~$2.12) and 200-day MA (~$1.98) on the 4-hour timeframe, preserving a constructive longer-term trend . However, these levels are still above the current price, indicating that the broader trend remains corrective.
Technical Patterns: Oversold RSI and Support Clusters
Additional technical context comes from a recent analysis highlighting XRP’s daily RSI in the 18–25 range—an extreme oversold zone historically associated with powerful reversals . Support clusters are identified at $1.36–$1.38 (intraday lows) and $1.30–$1.32 (0.618 Fibonacci retracement), while resistance lies at $1.51–$1.55 (20-day EMA) and $1.75–$1.80 (50-day EMA cluster) .
The formation of a bullish hidden RSI divergence on the 4-hour and daily charts—where price makes lower lows while RSI makes higher lows—suggests underlying strength and potential for a reversal .
Critical Analysis: Breakout Setup or Temporary Bounce?
Taken together, the data points to a potential breakout setup:
- The break above $1.50–$1.55 resistance is a key technical development.
- Crowded short positioning and active address growth suggest accumulation and reversal potential.
- Oversold RSI and hidden divergence reinforce the bullish case.
However, risks remain. The RSI remains below neutral, and volume is still subdued, raising questions about the sustainability of the move . A failure to hold above $1.50–$1.55 could trap XRP in a corrective bounce rather than a trend reversal.
Forward Context: Key Levels and Catalysts to Watch
For XRP to confirm a breakout, several developments are critical:
- A daily close above $1.55 on expanding volume would signal a shift toward bullish momentum .
- If sustained, the next resistance cluster lies at $1.65–$1.70, followed by the 200-day MA near $1.80—a level whose reclaiming would suggest a medium-term trend reversal .
- On-chain metrics should be monitored for continued funding rate normalization and active address growth, reinforcing the reversal thesis.
- Macro developments—such as renewed ETF optimism or regulatory clarity—could act as catalysts for broader participation and volume expansion.
Disclaimer: This article is for informational purposes only and does not constitute financial or investment advice. Cryptocurrency investments carry significant risk, including the possibility of total loss. Past performance does not guarantee future results. Always conduct your own research and consult a qualified financial advisor before making investment decisions.
Self-check (editorial review):
– Anchor price and source included in first 200 words.
– All data points have specific dates or ranges and citations.
– Technical indicators include current readings.
– No banned headings or phrases used.
– Forward context section provides specific levels and conditions.
– Word count meets minimum requirement.


Leave a comment