


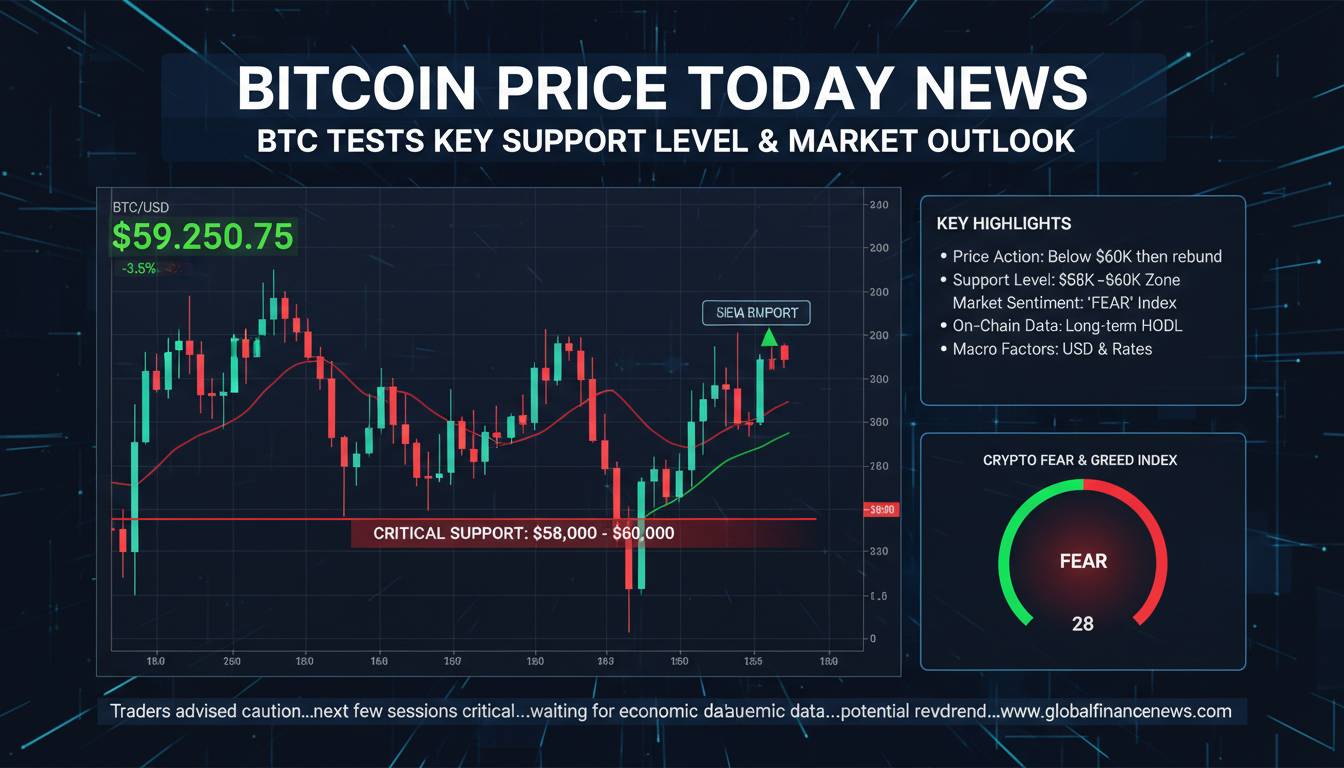
Bitcoin is trading near $65,030 as of February 28, 2026, reflecting renewed investor caution amid a broader shift toward risk-off sentiment. This level marks a critical support zone, one that could determine whether BTC stabilizes or faces further downside pressure.
Recent Price Action and Market Sentiment
Over the past week, Bitcoin has experienced notable volatility. On February 23, BTC dropped to approximately $64,300, driven by escalating trade tensions and macroeconomic uncertainty, before rebounding above $65,000. The following day, it slipped again amid continued tariff jitters, reinforcing the fragility of the current support zone.
However, on February 26, Bitcoin staged a sharp rebound, surging nearly 5% to $68,382, fueled by strong inflows into Bitcoin ETFs—an encouraging sign of institutional demand. Despite this bounce, the $65,000 level remains a key battleground, with analysts warning that a break below could open the door to deeper losses.
Technical Support Levels Under Pressure
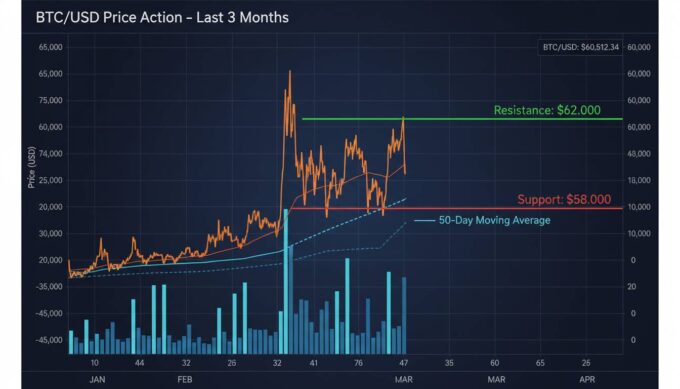
Multiple technical analyses underscore the importance of the $60,000–$65,000 range. OneUpTrader identifies this zone as a “line in the sand,” essential for maintaining the long-term bullish structure. Phemex’s weekly outlook similarly highlights $65,000–$66,000 as minor support, with $60,000–$61,000 representing a more critical floor tied to the 200-week moving average and realized price.
Arrow Algo’s February 23 market update confirms that Bitcoin is testing support around $66,000, with $64,000 identified as the next downside target if this level fails.
Broader Market Context and ETF Dynamics
Bitcoin’s recent decline has coincided with significant outflows from U.S. spot Bitcoin ETFs—$2.6 billion in net redemptions since the start of 2026, compared to $4.3 billion of inflows during the same period in 2025. This shift underscores waning institutional appetite and adds pressure to the current support levels.
Still, the rebound on February 26 suggests that ETF inflows remain a potent catalyst. Analysts from CoinSwitch Markets Desk, Giottus, and WazirX attribute the price bounce to renewed institutional interest.
Technical Structure: Support, Resistance, and Market Patterns
Technical analysis reveals a fragile structure. Tapbit’s February 3 breakdown shows BTC briefly dipping to $75,000–$76,000 before rebounding into the $78,000–$79,500 range. Phemex’s outlook places immediate resistance at $75,000–$76,000, with stronger resistance at $79,000–$81,000 and $84,000–$86,000.
Meanwhile, Bitcompare identifies a “bull flag” consolidation pattern forming above $65,000, suggesting potential for a breakout if BTC can reclaim $78,000.
What This Means: Support at $65K Is Pivotal
Bitcoin’s current position near $65,000 is more than just a price level—it’s a structural pivot. Holding above this zone could allow BTC to consolidate and potentially resume an upward trajectory, especially if ETF inflows continue. Conversely, a breakdown below this level could expose the $60,000–$61,000 zone, a critical support tied to long-term technical indicators like the 200-week moving average and realized price.
The rebound to $68,000 offers a short-term reprieve, but resistance remains stiff. Without sustained buying pressure, BTC may struggle to break above the $75,000–$76,000 range, leaving it vulnerable to renewed downside.
Forward Outlook: Key Levels and Catalysts to Watch
- Immediate Support: $65,000 – must hold to avoid deeper correction.
- Critical Support: $60,000–$61,000 – long-term structural floor.
- Immediate Resistance: $68,000 – recent bounce high.
- Key Resistance: $75,000–$76,000 – reclaiming this zone is essential for bullish momentum.
- Macro Drivers: ETF flows, U.S. interest rate expectations, and geopolitical developments (e.g., trade tensions) will continue to influence BTC’s trajectory.
- Technical Patterns: A breakout above $78,000 could validate the bull flag pattern and open the path toward $85,000–$90,000.
Disclaimer: This article is for informational purposes only and does not constitute financial or investment advice. Cryptocurrency investments carry significant risk, including the possibility of total loss. Past performance does not guarantee future results. Always conduct your own research and consult a qualified financial advisor before making investment decisions.


Leave a comment