


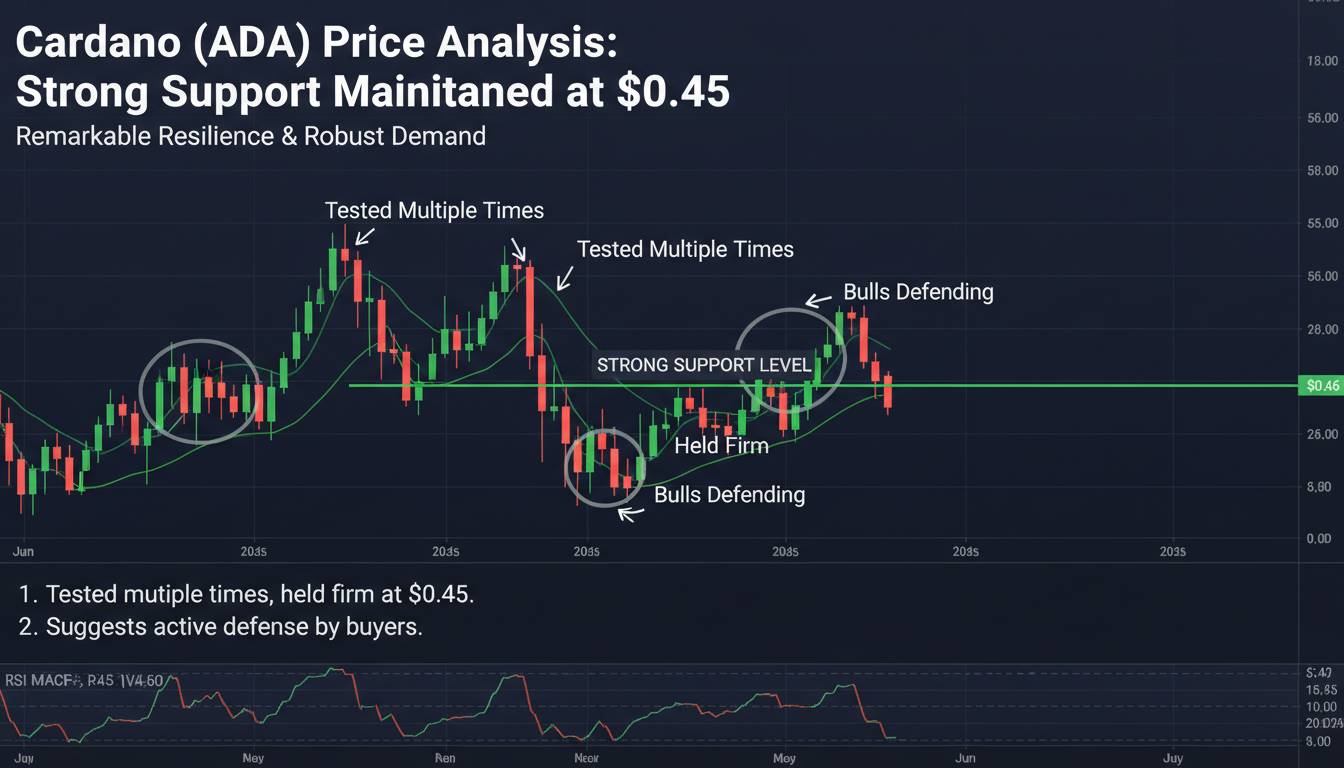
The strong support at $0.45 for Cardano (ADA) remains intact, preventing deeper losses and anchoring price action amid volatile trading. In recent weeks, ADA has bounced off this level, signaling its importance as a demand zone even as broader market pressures persist. Let’s dive deeper into what’s driving this stability and what could happen next.
Technical Foundations: Why $0.45 Matters
A Solid Floor Amid Weakness
- Technical charts show ADA consistently reclaiming support near $0.45, improving short-term structure after rebounds from long-term trendlines.
- On-chain metrics reinforce this zone’s strength—bullish divergence in CMF, OBV breaking its downtrend, and a notable drop in spent coins (about 27%) point to buyers stepping in around $0.45.
These signals suggest $0.45 isn’t just a price—it’s a psychological and structural anchor.
Patterns Suggest Contained Rebound Potential
- Technical setups like descending triangles and falling wedge patterns cluster near $0.42–$0.45, hinting at a constrained but potent breakout zone.
- A breakout above this range, with volume, could validate renewed upside, especially if momentum shifts away from oversold territory.
“A clean breakout above $0.42 with strong volume could invalidate the bearish bias… weekly close above $0.45 would further shift the bias toward neutrality or bullishness.”
Market Context: What’s Behind the Hold
Whales and Strengthening Fundamentals
- Whale accumulation has been observed near the $0.42–$0.45 range, signaling institutional belief in that price as a floor.
- ADA’s ecosystem developments—like the Midnight sidechain launch and increasing DeFi TVL—bolster sentiment and may support price stabilization.
Oversold Conditions Tie Into Support Resilience
- RSI readings near 28–30 suggest oversold conditions, which often attract technical buyers at these levels.
- These oversold signals are also visible in other indicators, such as the MACD showing potential for bullish divergence if $0.45 holds.
Potential Scenarios: Next Moves for ADA
1. Bounce and Recovery
If $0.45 holds, ADA could rebound toward:
- Resistance at $0.48–$0.50, where selling pressure might pause a rally.
- A breakout above $0.50 could pave the way to higher targets near $0.55 or even $0.60, supported by bullish technical patterns and renewed investor interest.
2. Consolidation Within Range
Should buying interest cool, ADA could hover in the $0.45–$0.48 range, forming a base before deciding the next leg. This could create a tight range—favoring short-term traders and keeping broader bears in check unless volume picks up.
3. Breakdown Risk
Loss of the $0.45 level could open the door to:
- A slide toward $0.42 and lower—but technical reports point to deeper supports near $0.39 and $0.38.
- If these fail, ADA could test $0.32–$0.36, where previous demand zones exist.
In summary, $0.45 is a critical guardrail—holding it may preserve bullish structure, but losing it could trigger broader weakness.
Real-World Parallel: Why Support Levels Endure
Many altcoins bounce off key levels due to psychological anchoring—traders view a price as a “floor,” reinforcing buying interest. ADA’s repeated support at $0.45 mirrors this behavior. When whales and technical indicators align, it adds depth to that floor, making it harder to breach.
Conclusion
Cardano’s ability to stay above $0.45 is noteworthy in an unstable market. Bullish signs—like divergence in volume metrics and whale accumulation—underline this level’s importance. Holding $0.45 may allow for a measured bounce toward $0.50+, while a breakdown risks deeper corrections toward $0.42 or below. Traders should watch volume and technical patterns carefully for confirmation.
FAQs
How strong is the $0.45 support level for ADA?
It’s a key zone reinforced by trendline structure, on-chain activity, and technical divergence, making it more than just a round-number support.
What price could ADA target if it holds $0.45?
A recovery may reach $0.48–$0.50 initially, with upside potential toward $0.55–$0.60 if momentum accelerates.
What happens if $0.45 breaks?
A breach could test immediate support near $0.42, with deeper correction risk toward $0.39 or $0.32 depending on market sentiment.
Why are whale movements significant near this level?
Large holders defending or accumulating near $0.45 add credibility and stability to the support structure due to their influence on order flow.
Do technical indicators support a rebound from $0.45?
Yes—oversold RSI and weakening bearish momentum alongside falling wedge or triangle patterns suggest rebound potential if volume aligns.
Should new traders step in at $0.45?
Caution is advised: while support looks stable, confirming signals like volume and price action should guide entry decisions to mitigate risk.


Leave a comment