


The Bitcoin Dominance Chart is more than just a number—it’s a window into the shifting tides of the cryptocurrency market. When Bitcoin’s share of the total crypto cap rises, it often signals caution. When it falls, anticipation of altcoin momentum grows. This article unpacks the nuances of Bitcoin dominance and explores what it means for altcoins, weaving in real-world examples, expert insights, market trends, and a dash of human unpredictability—because markets rarely behave perfectly.
What Bitcoin Dominance Reveals About Market Dynamics
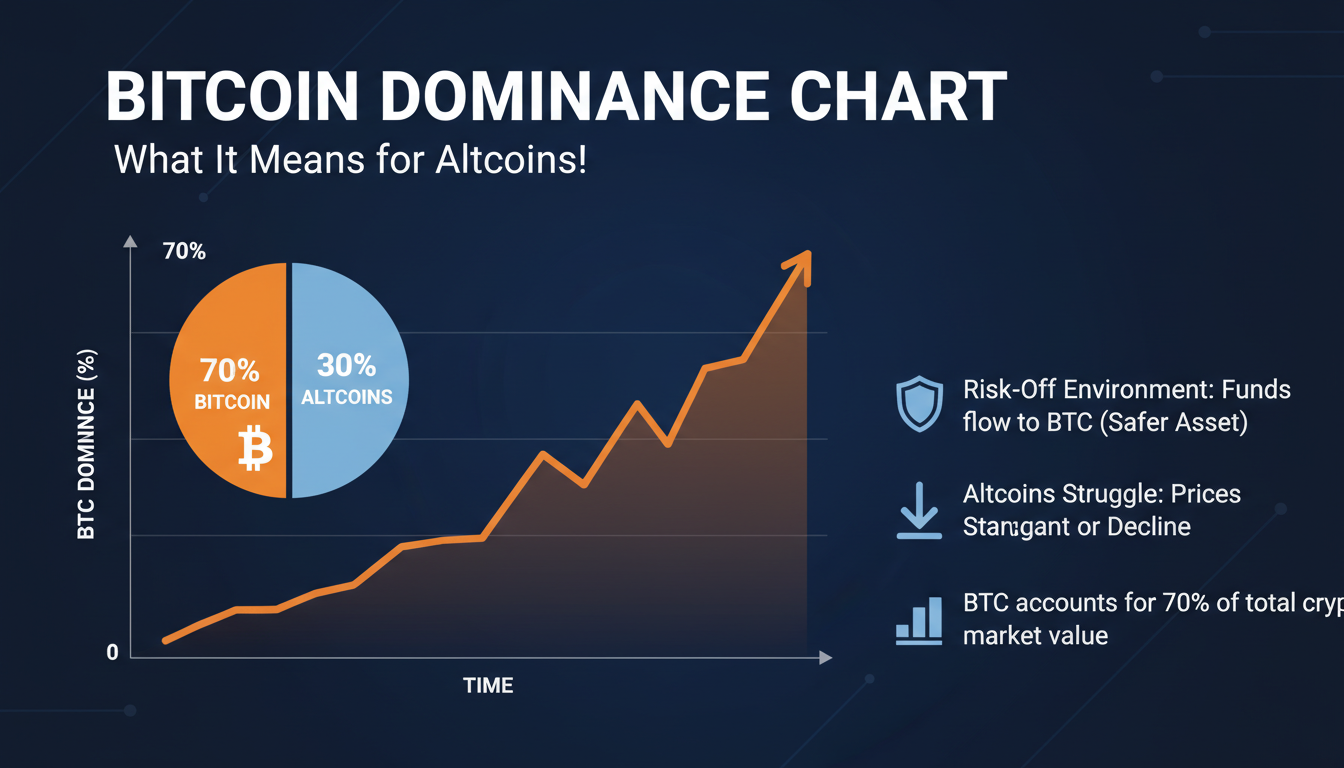
At its core, Bitcoin Dominance (BTC‑D) represents Bitcoin’s percentage of the total cryptocurrency market capitalization. It’s a simple formula—Bitcoin’s market cap divided by the total crypto market cap, multiplied by 100 . This ratio frequently serves as a sentiment barometer:
- Rising dominance often reflects risk aversion, with investors flocking to BTC as a “safer” asset during market turbulence .
- Falling dominance, conversely, can herald an “altseason,” with capital rotating toward altcoins in search of higher returns .
Real‑World Example
In early 2025, Bitcoin’s dominance climbed to over 62%, levels last seen in 2021, amid global economic uncertainty and institutional accumulation . This suggested that investors were seeking stability in BTC during shaky times.
Interpreting the Chart: Patterns and Portents
The Bitcoin Dominance Chart—widely available on platforms like CoinMarketCap—tracks dominance across timeframes (daily, weekly, yearly). It helps traders spot cycles, sentiment shifts, and potential rotations between BTC and altcoins .
Key Behavioral Signals
- High dominance: Altcoins struggle to rally; liquidity and attention concentrate around Bitcoin .
- Low dominance: Risk appetite builds, and altcoins often outperform Bitcoin significantly .
- Sharp shifts: Sudden dominance changes can betray shifts in sentiment—either upcoming rallies or corrections .
Snapshot: What Happens
| BTC Dominance Trend | Bitcoin Behavior | Altcoin Behavior |
|———————|————————–|———————————————|
| Rising | Stabilizes or rises | Drops or underperforms |
| Falling | Flat or modest gains | Surges aggressively—potential for rallies |
| Flat | Market indecision | Often mirrors overall trend |
When Altcoin Seasons Ignite—or Stay Cool
Altseason refers to periods when altcoins consistently outperform Bitcoin. Observers typically watch for Bitcoin dominance dipping below 55%, a traditional signal of green shoots for altcoin performance .
Case in Point: The 2025 Dip
In October 2025, a decline in BTC dominance from 64% to 61% sparked a 15% surge in altcoin market capitalization, underscoring a shift in risk sentiment and investor behavior . Yet analysts caution such dips don’t always mark altseason onset. In November, a dip to 58.9% was interpreted not as rotation but as deleveraging, due to lackluster on‑chain activity and minor altcoin traction .
“For any sustainable rotation into alts, we would first need to see the majors stabilise and establish a price consolidation,” said Rohit Apte, Head of Markets at Hex Trust .
Macro Factors Shaping the Cycle
The 2025 altcoin movement wasn’t pure speculation. It was propelled by macroeconomic tailwinds like global liquidity growth and U.S. M2 expansion, combined with structural advancements such as DeFi expansion and cross‑chain innovation .
What This Means for Market Participants
Traders
- Watch for dips in BTC dominance as early signals—but don’t jump in until strong on‑chain activity appears.
- Track cross‑pair strength (e.g., ETH/BTC, XRP/BTC) to spot early altcoin leaders .
- Be ready for fast shifts: markets often behave unpredictably when sentiment changes abruptly.
Investors
- Institutional flows such as ETFs and corporate treasuries have significantly bolstered Bitcoin’s dominance .
- Altcoin exposure may be best timed during consolidations, not peaks in dominance dips or hype-fueled rallies.
Industry Insights
Certain altcoins tend to lead during early rotation phases. In 2025, coins like Ethereum, Arbitrum, and meme-layer tokens like Little Pepe drew attention for their strong fundamentals and speculative appeal .
Conclusion
Bitcoin Dominance is a powerful lens through which to view crypto market psychology. Rising dominance hints at risk-off sentiment and BTC’s role as a sanctuary. Falling dominance often paves the way for altcoin revival—but caution matters. Timing, macro context, and on‑chain validation are essential. Whether you’re a trader eyeing next moves or an investor planning strategic exposure, understanding this chart provides clarity amid crypto’s notorious volatility.
FAQs
How is Bitcoin Dominance calculated?
Bitcoin Dominance is calculated by dividing Bitcoin’s market cap by the total crypto market capitalization, then multiplying by 100 .
What typically happens to altcoins when BTC dominance rises?
Altcoins often underperform when BTC.D rises—liquidity flows back into Bitcoin, leaving smaller cap assets struggling to rally .
Does a falling BTC dominance always indicate an altseason?
Not necessarily. While it can signal a shift in sentiment, prolonged on-chain activity and stabilization in major assets often need to follow before a genuine altseason is confirmed .
What macro factors can influence Bitcoin dominance?
Institutional adoption (e.g., ETFs), corporate treasury accumulation, economic volatility, and regulatory clarity can significantly impact BTC.D levels .
Which altcoins tend to perform well when BTC dominance dips?
Ethereum, prominent Layer‑2 chains like Arbitrum, and speculative meme projects with strong communities have often seen big gains during early rotation phases .
Is BTC dominance a reliable long-term indicator?
It’s most useful when combined with broader context—like market cycles, macro trends, and on-chain metrics. Used cautiously, it can help anticipate market bends, not predict them outright.


Leave a comment