Key Points
- Ethereum has surged past $3,400, with dominance rising from 9.04% to over 11%.
- Bitcoin dominance dropped from 66% to 62.89%, showing an incoming altcoin season.
- Altcoin’s market cap is approaching breakout levels, and bullish patterns are forming.
Ethereum is again in the spotlight, with Bitcoin’s dominance slipping and capital flowing more into the altcoins. ETH is now gaining ground against BTC in both price and market share. This is happening at a time when the cryptomarket could be on the brink of another altcoin season.
Ethereum ETF market saw a staggering $402 million in inflows just yesterday. BlackRock was leading the charge after pulling in a staggering $394 million.
Moreover, over the past week, Ethereum’s performance has outpaced Bitcoin’s. Also, the technical indicators show that this trend may continue.
Ethereum ETF Inflows Beat Bitcoin’s
On 18 July, the Ethereum ETF market experienced inflows of around $402 million, according to data from Farside Investors. In contrast, the Bitcoin ETF market raked in only $363 million. This is a stark indicator of the difference in investor interest.
More interestingly, BlackRock’s ETHA Ethereum ETF saw impressive inflows, totaling $394 million. Meanwhile, its IBIT Bitcoin ETF outpaced ETHA with a notable $496 million.
BlackRock also experienced inflows of nearly half a billion dollars of ETH ($547M) on 17 July (the day prior). It was more than its Bitcoin inflow of $497M.
According to updates from Arkham Intelligence, in a recent X post. This means that, on average, BlackRock’s Ethereum inflows are over five times that of BTC.
Bitcoin Dominance Drops as Ethereum ETF Inflows Surge
In addition to being outperformed by the Ethereum ETF, Bitcoin’s dominance has dropped over the past few weeks. This metric has slid down from a high of 66% in late June to under 63% today.
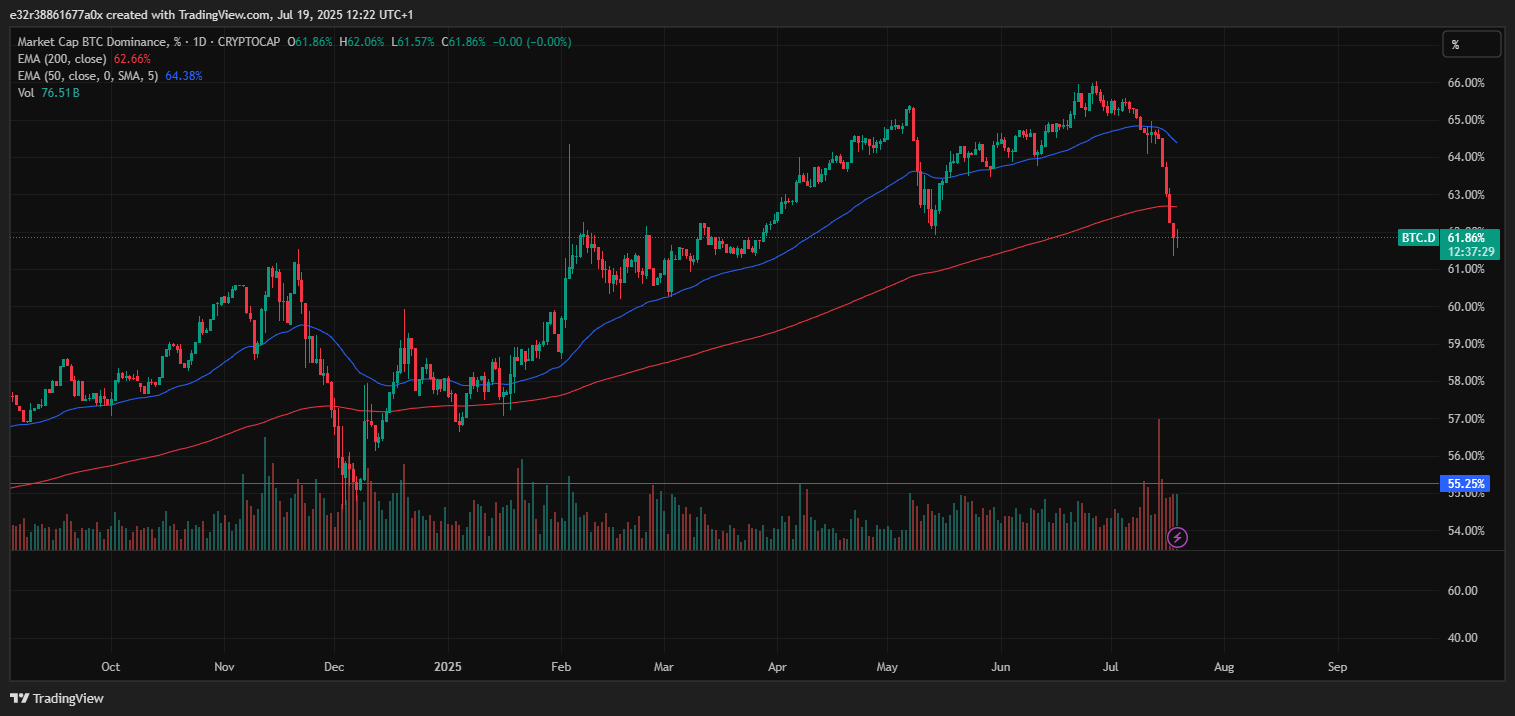
Capital is rotating from Bitcoin into other assets, especially Ethereum. Adding to this sentiment is how Ethereum’s dominance has climbed from 9.04% to over 11%. It has gained more ground than Bitcoin.
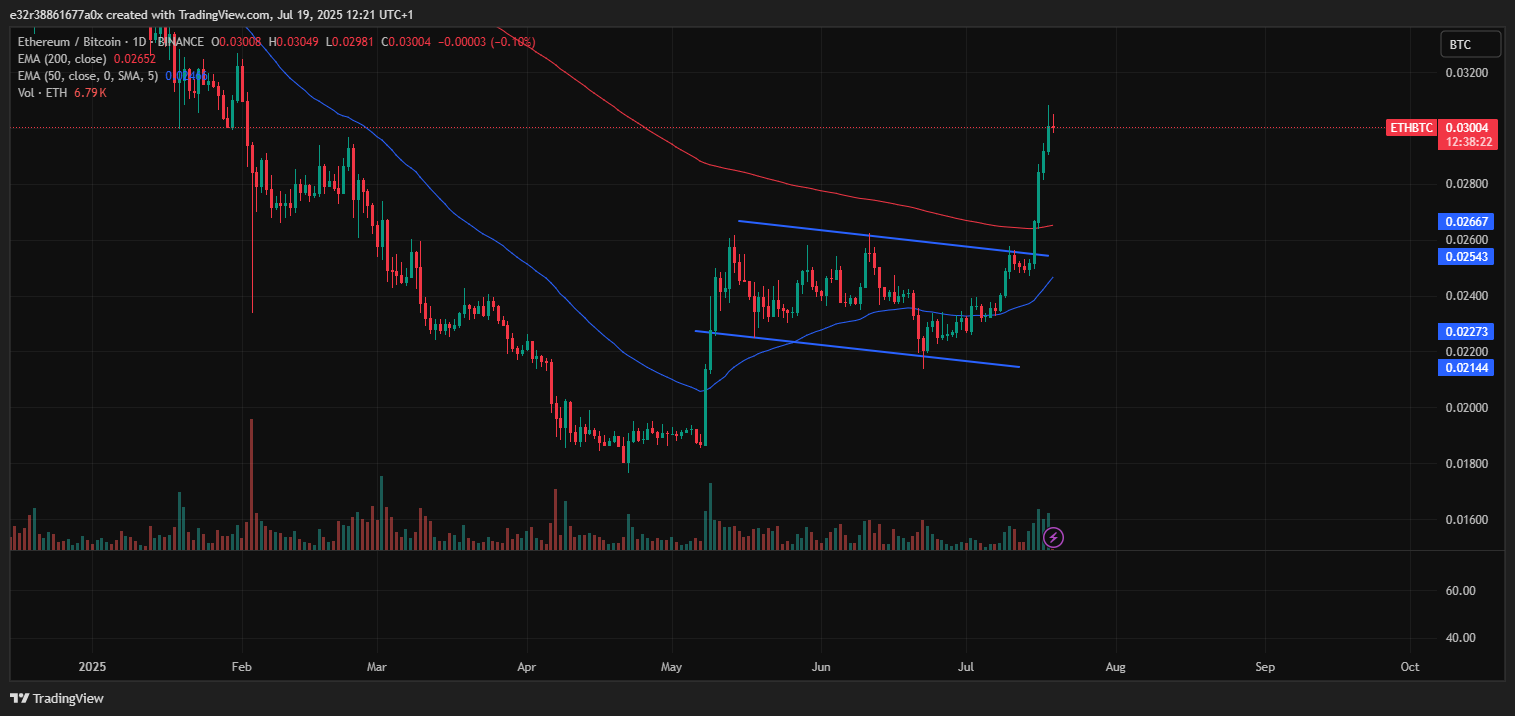
ETH cryptocurrency has appreciated more than 16% against BTC this week on the ETH/BTC charts. This is a sign that buyers favor Ethereum in this market phase.
Ethereum Price Breaks Out Above $3,400
Ethereum also recently broke out above the $3,400 zone. This is a significant turning point for cryptocurrency. Analysts are watching the ETH/BTC chart closely. A bullish breakout from the flag pattern below indicates that more gains could follow.
The general market’s performance also supports the Ethereum-led rally. For example, the total crypto market cap rose 15% in July and hit an all-time high of $3.80 trillion.
Most of this growth came from altcoins, especially those following Ethereum’s trend. Even veteran analyst Peter Brandt highlighted this setup, stating that the market is likely entering a new altseason cycle.
Altcoin Index Strengthens
The Altcoin Season Index has jumped from 23 to 39 in just over two weeks. The rise shows that altcoins are gaining traction. However, it is still below the 75 threshold and not showing a full-blown altcoin season,
Several altcoins, including Sei (SEI), Bonk (BONK), Stellar (XLM), and XRP, have already outperformed Bitcoin in the last 90 days. If the trend continues, it could trigger a wave of capital moving into the alternative market.
In addition to this, the CoinMarketCap Fear and Greed Index is currently at 70. Also, it is showing that investors are highly optimistic. The more ETH rallies, the more likely investors will rotate into other coins with strong fundamentals or market momentum.