
Key Insights
- Bitcoin is facing strong resistance of nearly $120,000 and will likely consolidate for a while.
- Whale inflows of over 50,000 BTC show that there could be some short-term sell pressure.
- Despite the slowdown, ETF inflows are strong, with long-term bullish momentum.
Bitcoin has had a relatively calm week and has traded $117,000 and $123,000. Data shows that a slight dip could be coming in a few hours.
And this possibility can be frustrating for many investors on the surface. However, the data shows that the next few weeks are worth watching.
Bitcoin Faces Resistance at $120,000
Bitcoin’s struggle to break above the $120,000 mark continues. According to technical charts from TradingView, the bulls have attempted to push the price higher. However, the bears are not backing down.
The repeated rejections of Bitcoin near this price level suggest hesitation. The market may be entering a consolidation phase before moving higher.
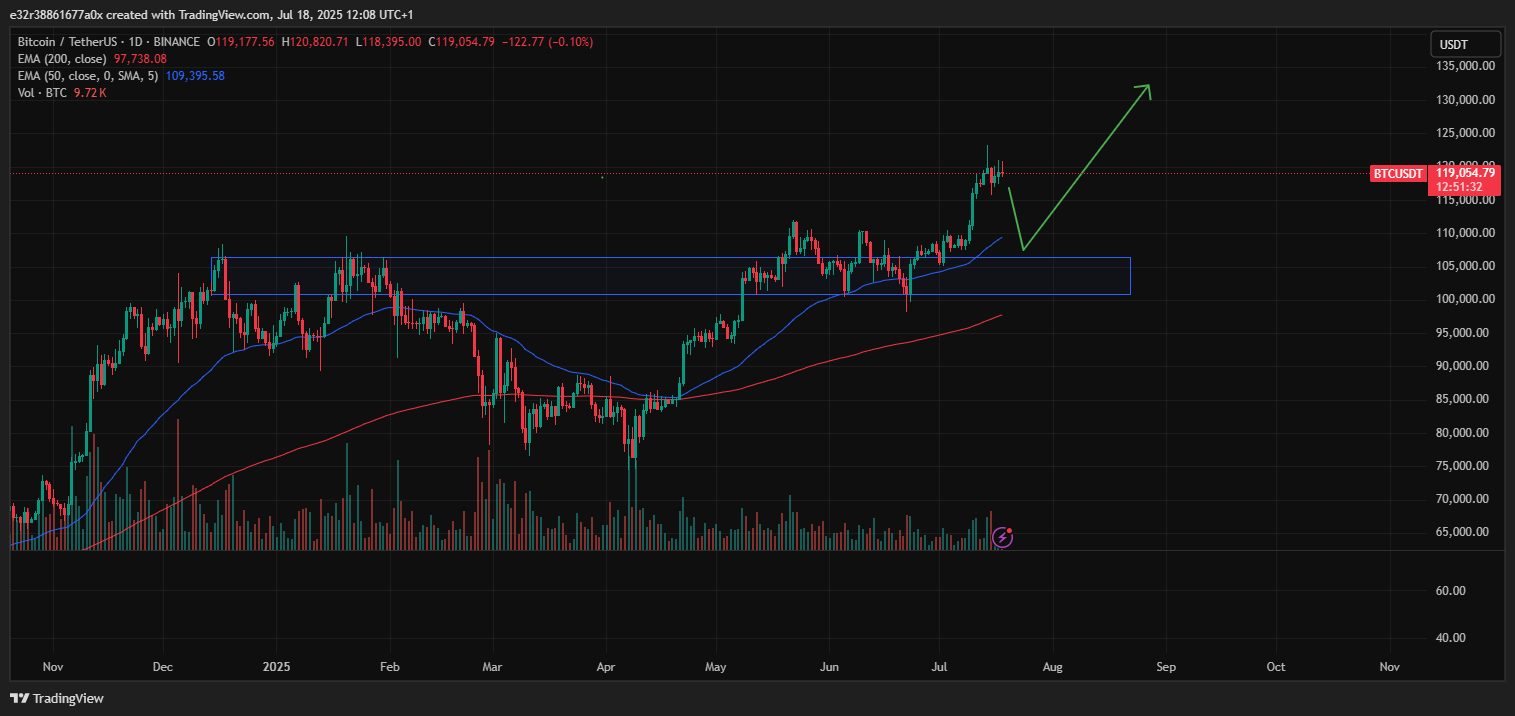
So far, Bitcoin has maintained strong support above $117,000. If bulls hold this ground, the next attempt to break past $123,218 could trigger an uptrend toward $135,729.
Still, a break below the $117,000 support may fail. Bitcoin could be ready to retest the $116,000 price level in the next few hours if this happens.
In an ideal bullish scenario, Bitcoin may eventually hit the target pattern of $150,000. But for now, the market is content with the sideways movement.
Whales Move $6 Billion in Bitcoin to Exchanges
On July 17, over 50,000 BTC were transferred from whale and mega whale wallets to exchanges. These Bitcoins were worth more than $6 billion at current prices. Data from CryptoQuant showed this trend, with large exchange inflows historically coming before price pullbacks.
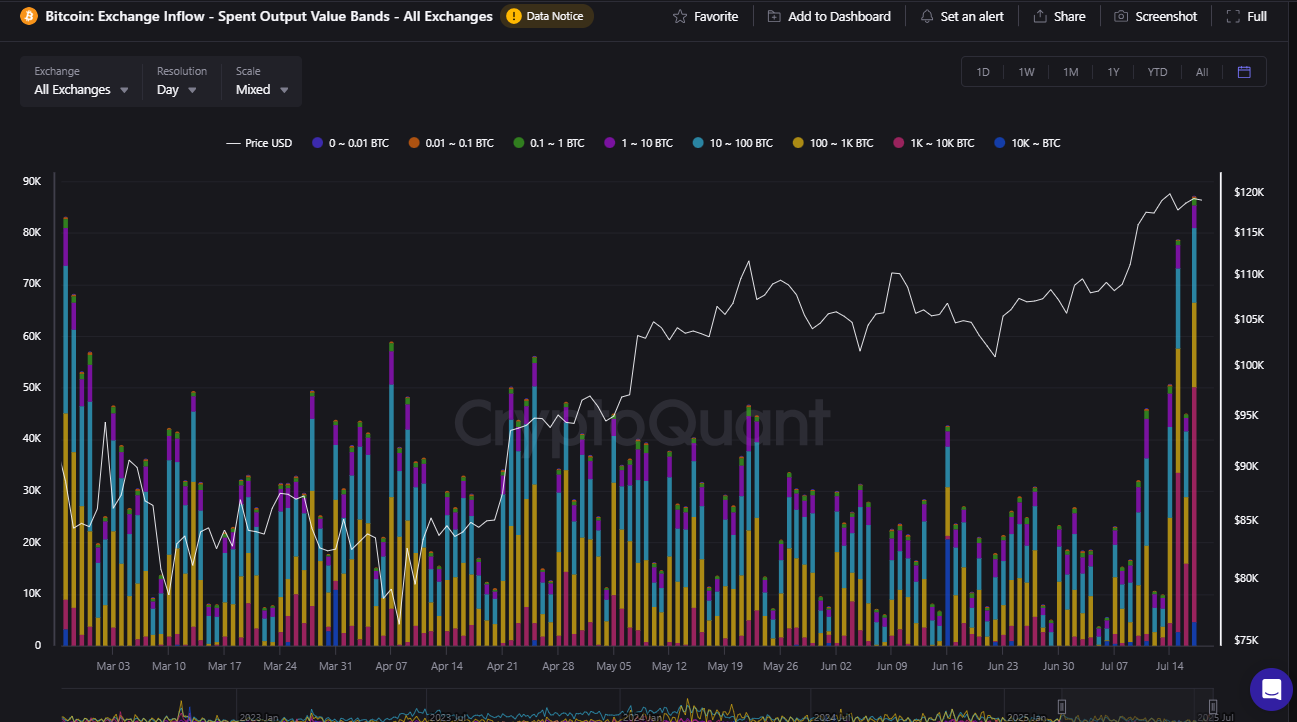
A similar pattern played out earlier in July. At this time, smaller inflows of 2,500 to 30,000 BTC led to minor corrections ranging between 1.5% and 1.7%.
Considering the size of the recent transfer, data further supports a 2.5% to 3% dip. This could bring Bitcoin down to the $116,000 support level.
Again, all of this hinges on the $117,000 price level. If this zone fails to hold, the next support lies near $113,600, which is identified by the Fibonacci extension tool.
A drop towards this level would be massive and likely open the door to more short-term bearish momentum.
Retail Traders Start Taking Profits
It’s not just whales moving Bitcoin around. Short-term holders, typically newer market participants, also show profit-taking signs. The short-term Spent Output Profit Ratio (SOPR) spiked to 1.05 on July 16.
For context, the SOPR tracks whether or not the recently acquired BTC is being sold at a profit. As it stands, the current readings are the highest level in over a month.
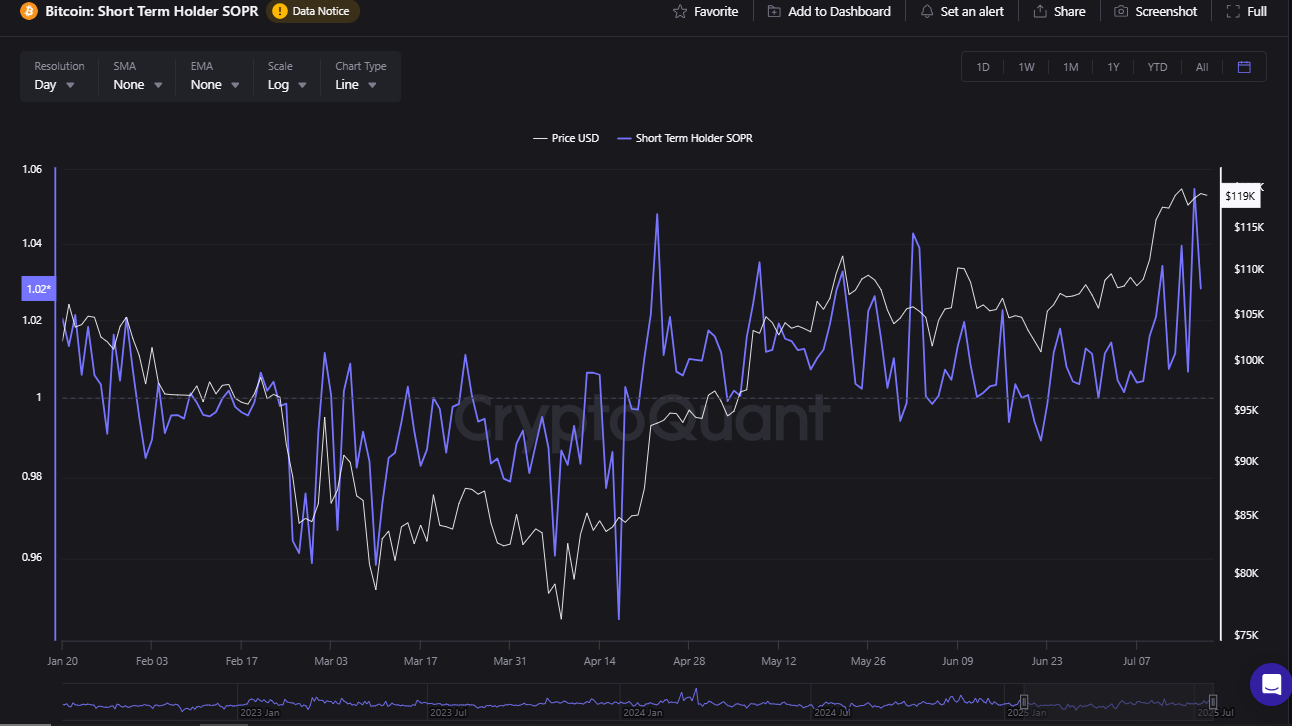
Historically, a SOPR reading above 1 means that most short-term holders sell their Bitcoin for more than they paid. The SOPR has cooled slightly to 1.02. However, it’s still above neutral territory and shows that many traders are realizing gains.
Past spikes in SOPR have usually led to minor price corrections. So, unless this metric drops closer to 1.00, the market will likely suffer more downside pressure.
ETFs See $5.2 Billion in Inflows Since July 2
Despite the short-term selling pressure, Bitcoin’s long-term outlook is still positive. According to data from Farside Investors, the U.S.-based Bitcoin ETFs attracted $799.4 million in inflows on July 17 alone. This marked their 10th straight day of positive inflows.
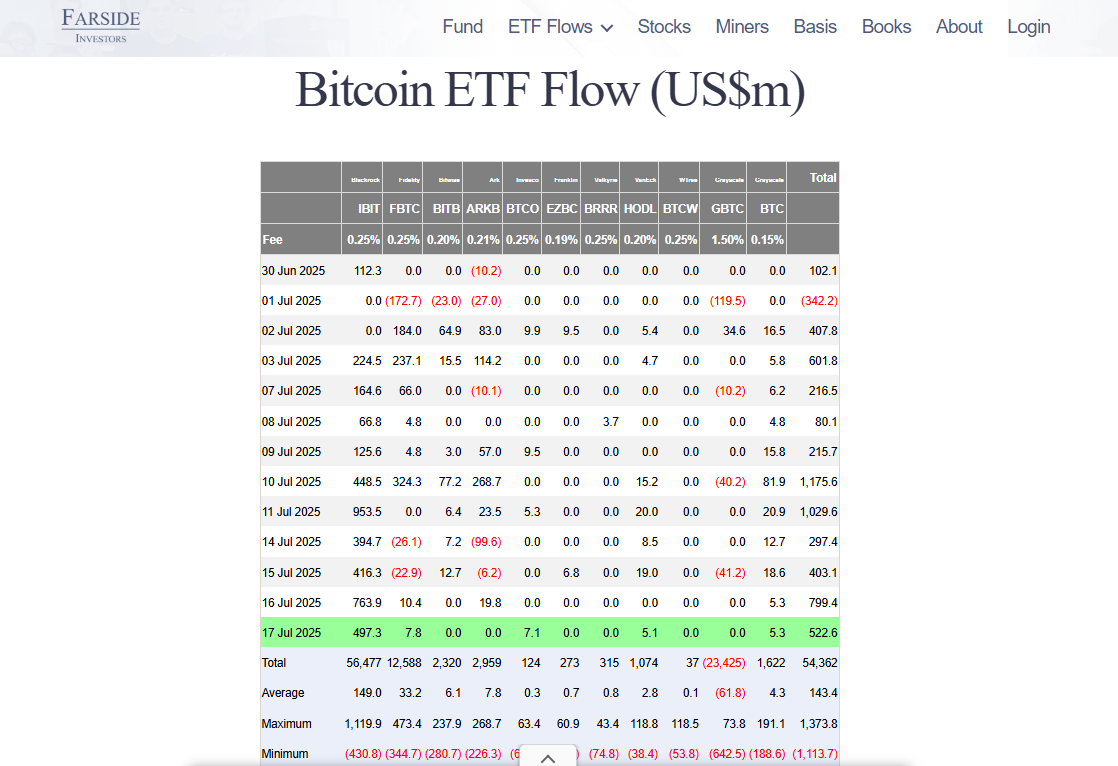
In particular, since July 2, more than $5.2 billion has flowed into these funds. So far, Bitcoin continues to trade in a tight range, with resistance near $123,218 and support around $117,000.
This range could hold for a while as the market digests the recent whale activity. However, any breaks below support or resistance could determine what happens next with the market.