
Key Points
- Bitcoin is trading between $116,000 and $123,000. The bulls and bears attempt to cause breakouts in either direction, tug both ways.
- Market data shows that trading activity is cooling among investors. However, the price outlook over the long term is still healthy.
- Macroeconomics and positive technical indicators could be the next triggers for a rebound.
Bitcoin was trading within a range at press time, holding steady between $116,000 and $123,000. This period of consolidation has created uncertainty.
It also shows that a major move may be just around the corner. Traders and investors are now watching the charts as both on-chain and technical indicators show signs of a coming breakout.
Pause of Bitcoin Before the Next Move
BTC price behavior over the past few weeks has been relatively quiet. According to the daily chart, the cryptocurrency has been stuck between $116,000 and $123,000. This price zone shows a balance between buyers and sellers, with neither side pushing the asset aggressively.
It is worth mentioning that significant support lies near the $114K level. This is also the lower boundary of Bitcoin’s long-term ascending channel. As long as Bitcoin stays above this level, the bullish trend will likely remain intact.
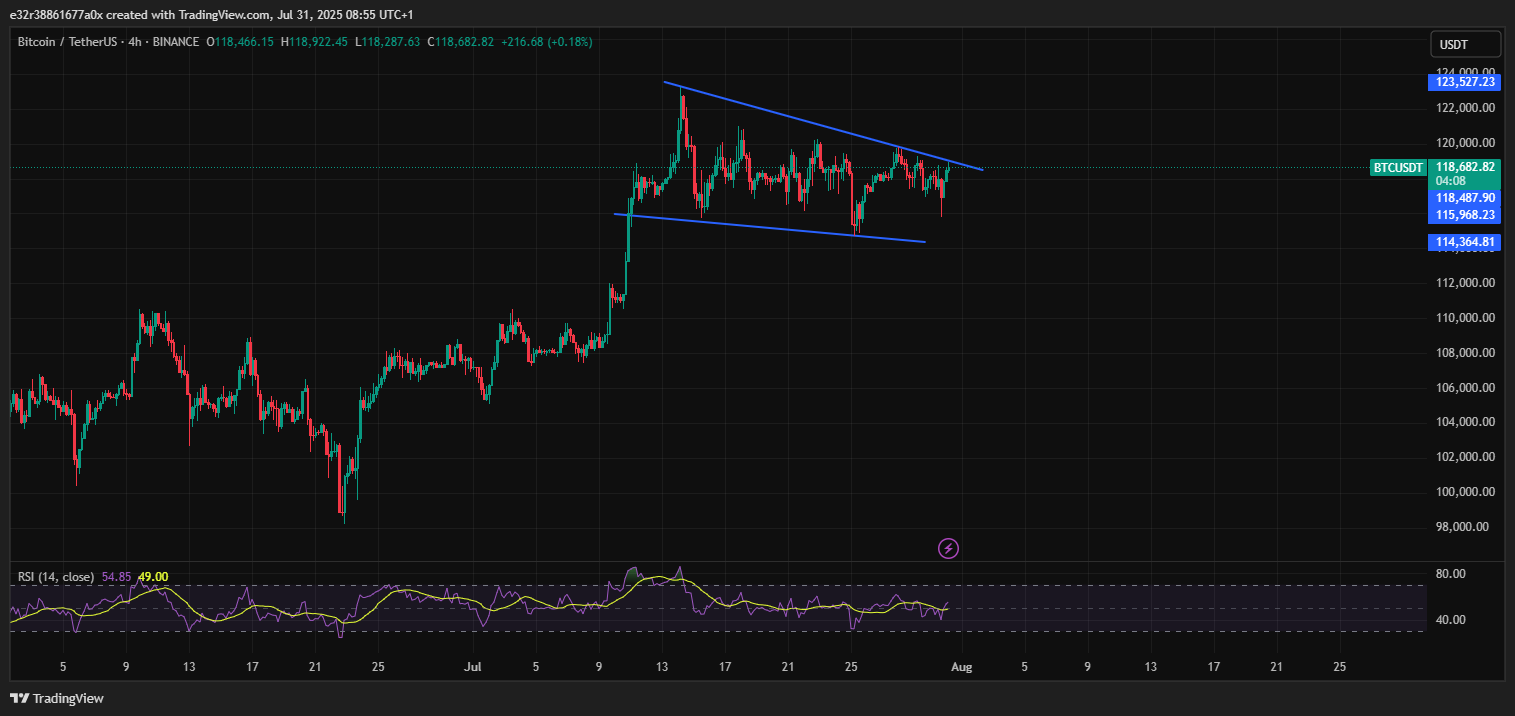
If it holds, the cryptocurrency’s price may retest the upper resistance at $123K. However, if this trendline breaks, prices could fall toward $111K within a short-term correction.
Over the 4-hour chart, the consolidation forms a bullish flag. It’s a continuation pattern that historically promises a higher move. In short, this indicates that BTC is pausing before resuming its upward trend.
On-Chain Metrics Support a Bullish Setup for Bitcoin
While Bitcoin trades near all-time highs, speculation is cooling down, especially in the futures market. According to CryptoQuant’s volume bubble map data, leverage has declined.
This contrasts with the overheated phases when BTC rose to $70K–$90K. The chart shows neutral or cooling phases, with green and grey bubbles replacing the once-dense red clusters.
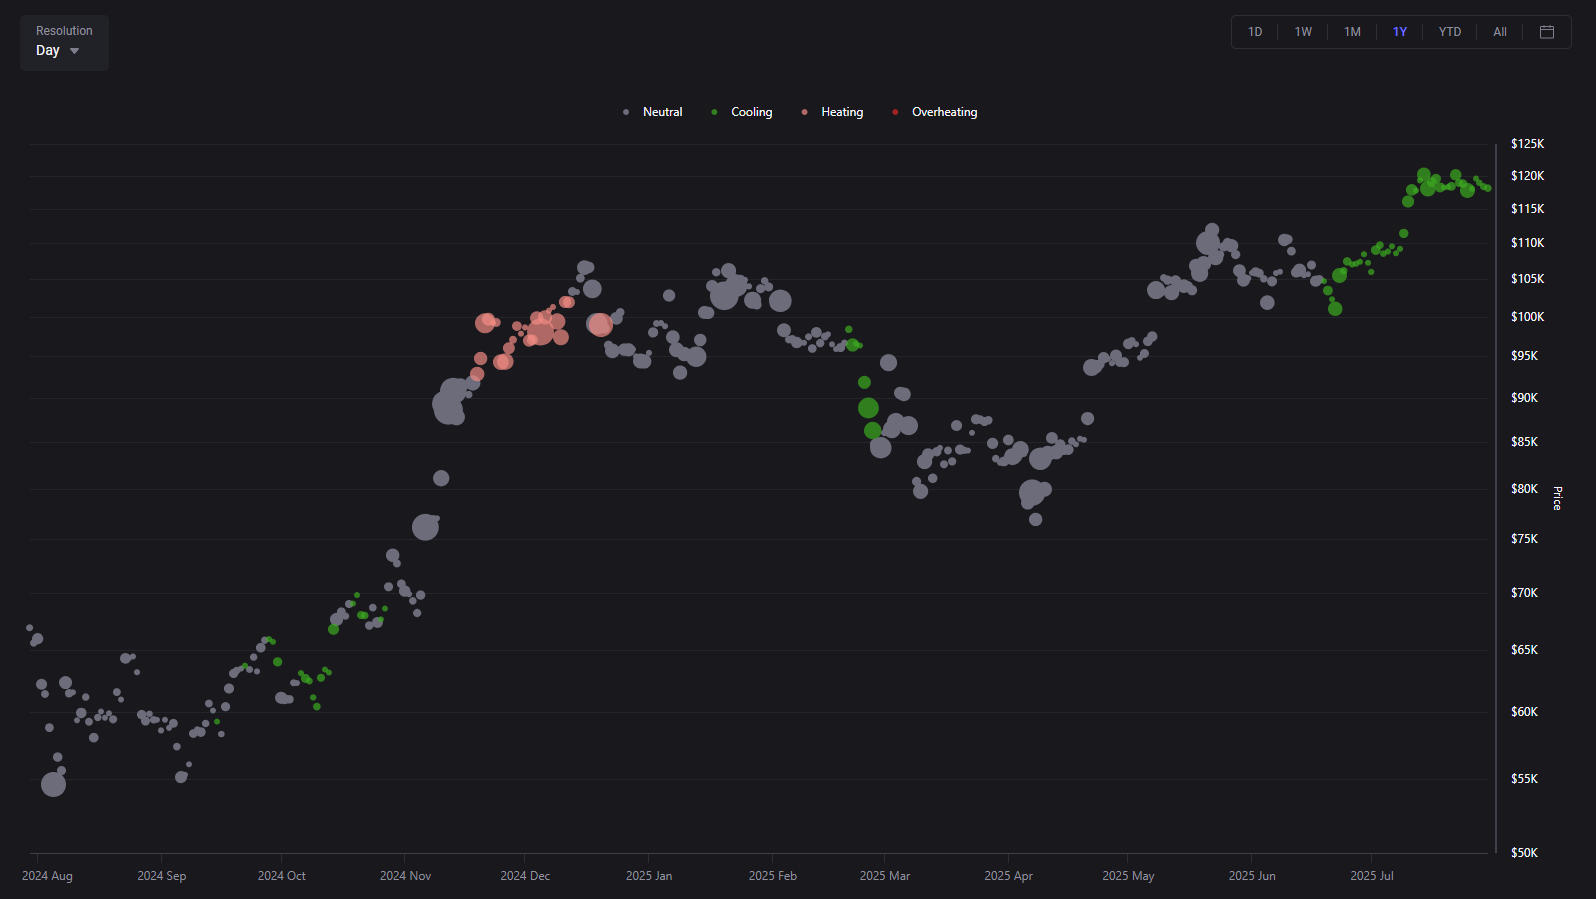
This indicates that traders are reducing risk. Moreover, the price is now supported by stronger organic demand rather than leveraged positions. Historically, this type of reset tends to come before healthy rallies.
This cooling-off period is no reason to panic. It strengthens the bullish narrative and indicates that Bitcoin’s rise above $100K was hype-driven and backed by real demand.
Coinbase Premium Turns Negative
One of the more surprising developments has been the change in the Coinbase Premium Index. For 62 days, this metric has been positive.
This shows strong US-based buying on Coinbase relative to Binance. However, it has turned negative and ended a 94-day streak of premium trading.
A negative premium has historically signaled weakened US spot demand. However, it doesn’t tell the whole story. According to analyst Boris Vest, Bitcoin is holding firm above $115K.
This shows that the aggressive buying slowed down. On the other hand, passive investors are still pulling in coins and are absorbing any sell pressure.
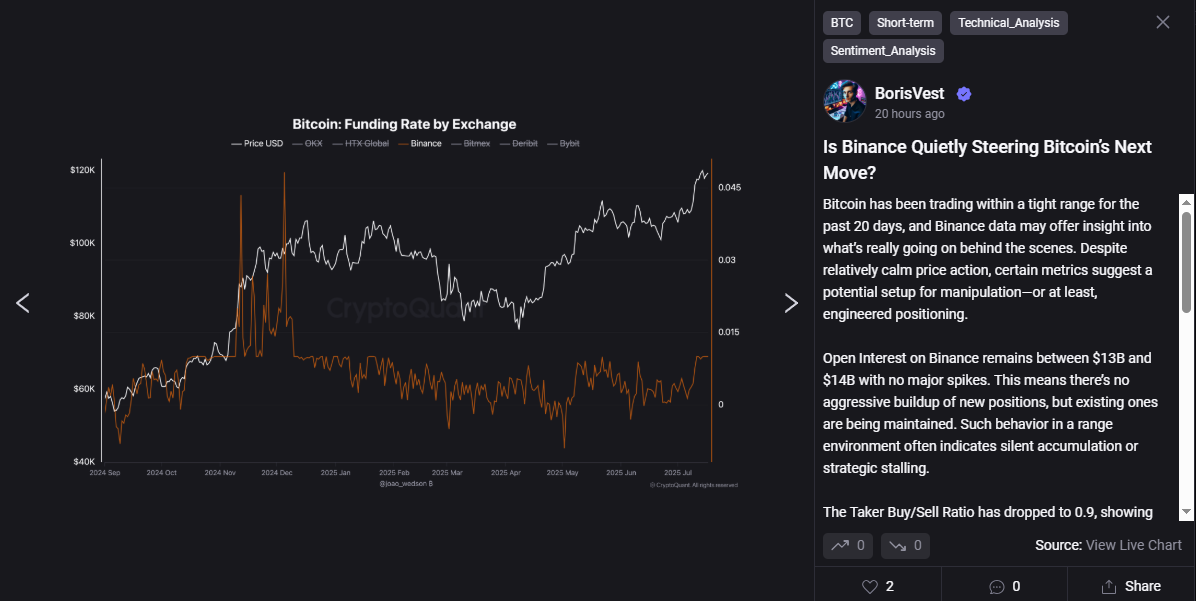
Coinglass data shows that Bitcoin’s futures funding rate is currently neutral at around 0.01%. This means that there is now no strong pull from either side.
Fundamentals and Sentiment Still Favor Bulls
Despite these changes in technical indicators, on-chain data still shows that investors are strong. Metrics like Net Realized Profit/Loss (NRPL) and Adjusted SOPR still show no signs of panic selling or profit-taking.
The SOPR, especially, is still well below 1.10 (usually the market’s overheated threshold). Simply put, most BTC holders are not rushing to exit the market. In other words, there is still a lot of optimistic energy among investors for the long term.
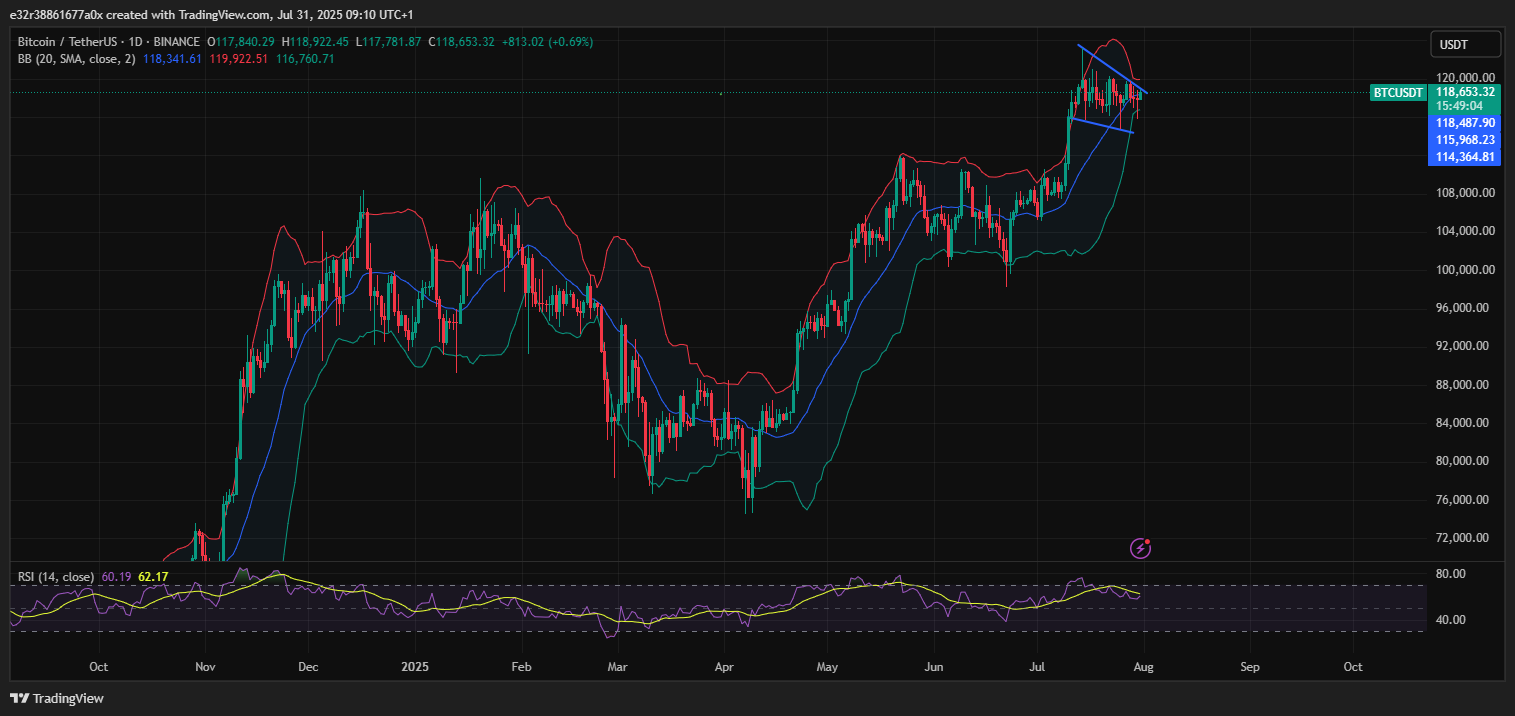
Another thing to note is that tools like the Bollinger Bands show that this may soon change. This is while Bitcoin has been relatively stable so far.
These bands indicate the market’s volatility. When they tighten, it usually means that a significant price jump (or dump) is inbound. And as trader Titan of Crypto puts it, “Bitcoin is in a pressure cooker, and a big move is brewing.”