Key Insights
- Artificial Superintelligence Alliance ($FET) displays bullish chart patterns like a falling wedge and a cup and handle.
- Analysts closely watch the $0.85 resistance level and the 200-week EMA at $0.773.
- A strong break above these points could trigger a rally towards $1.74, and even as high as $4.
$FET price action has been impressive lately, especially over the last month. The cryptocurrency has traded just underneath the $1 price level.
Analysts predict new highs for FET if momentum continues. A confirmed daily candlestick above key resistance could trigger the next rally.
FET Price Performance So Far
According to data from CoinMarketCap, FET is trading at around $0.7392 at the time of writing. This happened after its initial rejection from $0.885 over the last week.
CoinMarketCap data showed that the cryptocurrency is up by around 14% over the last month. Also, it was by around 2% over the last day.
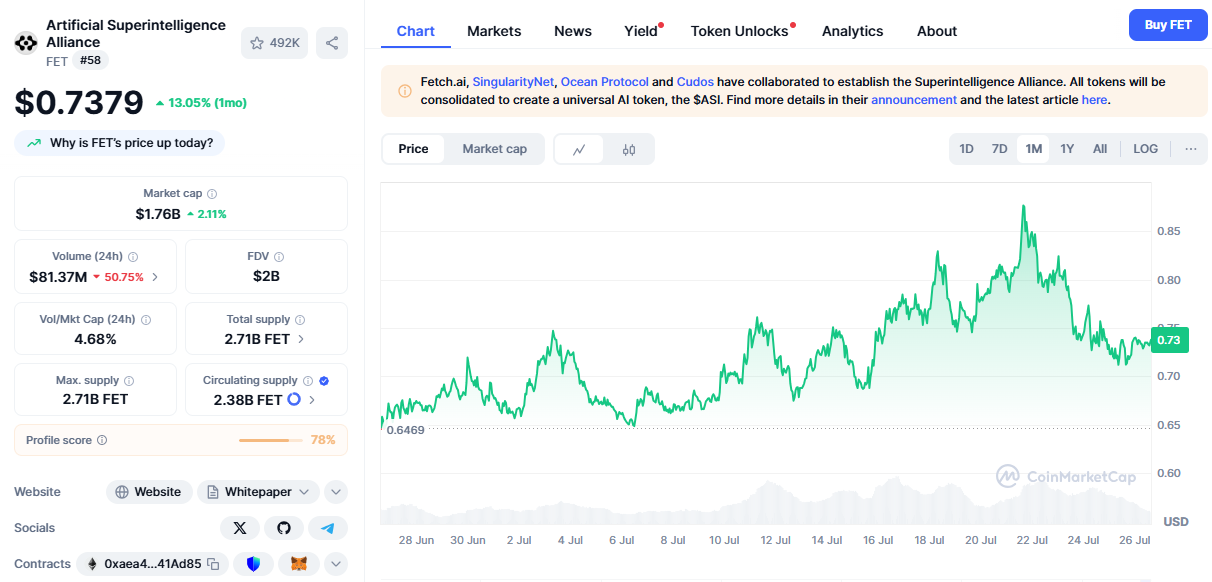
This monthly movement is modest by comparison. However, it has allowed FET to hold on to its position as the 58th largest cryptocurrency on the market. By capitalization, FET also remains one of the largest AI-based cryptocurrencies on the market.
The cryptocurrency has experienced an impressive 2.25% rise in market cap over the last 24 hours before writing. It has processed $81.9 Million in funds within the same timeframe.
All of the above indicates that the price performance of the cryptocurrency is relatively sluggish. Meanwhile, the bulls are likely waiting for an opportunity to take action.
What Do The Charts Say?
Starting from the weekly timeframe, the charts show that FET is currently in a falling wedge. This is a bullish formation, and typically comes before a breakout to the upside.
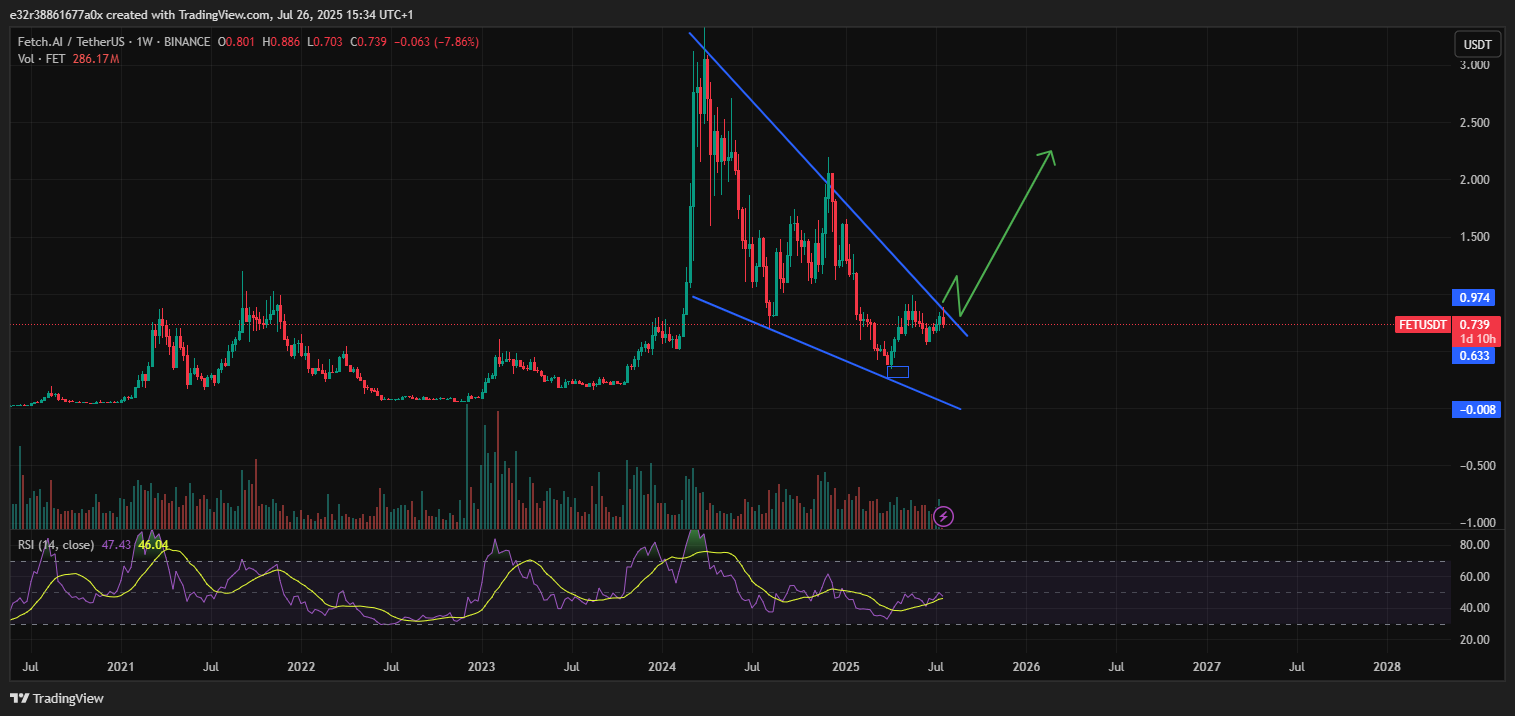
It is also worth mentioning that the cryptocurrency aims for a breakout above its 200-week EMA around $0.773. A break and close above this price level with a weekly candlestick would confirm a break of the falling wedge structure. It could also lead to a run towards $1 or over.
This said, a rejection from $0.773 would lead to a retest of the lower trendline of the wedge around $0.351. In essence, FET is at a critical juncture and could either soar strongly or crash hard.
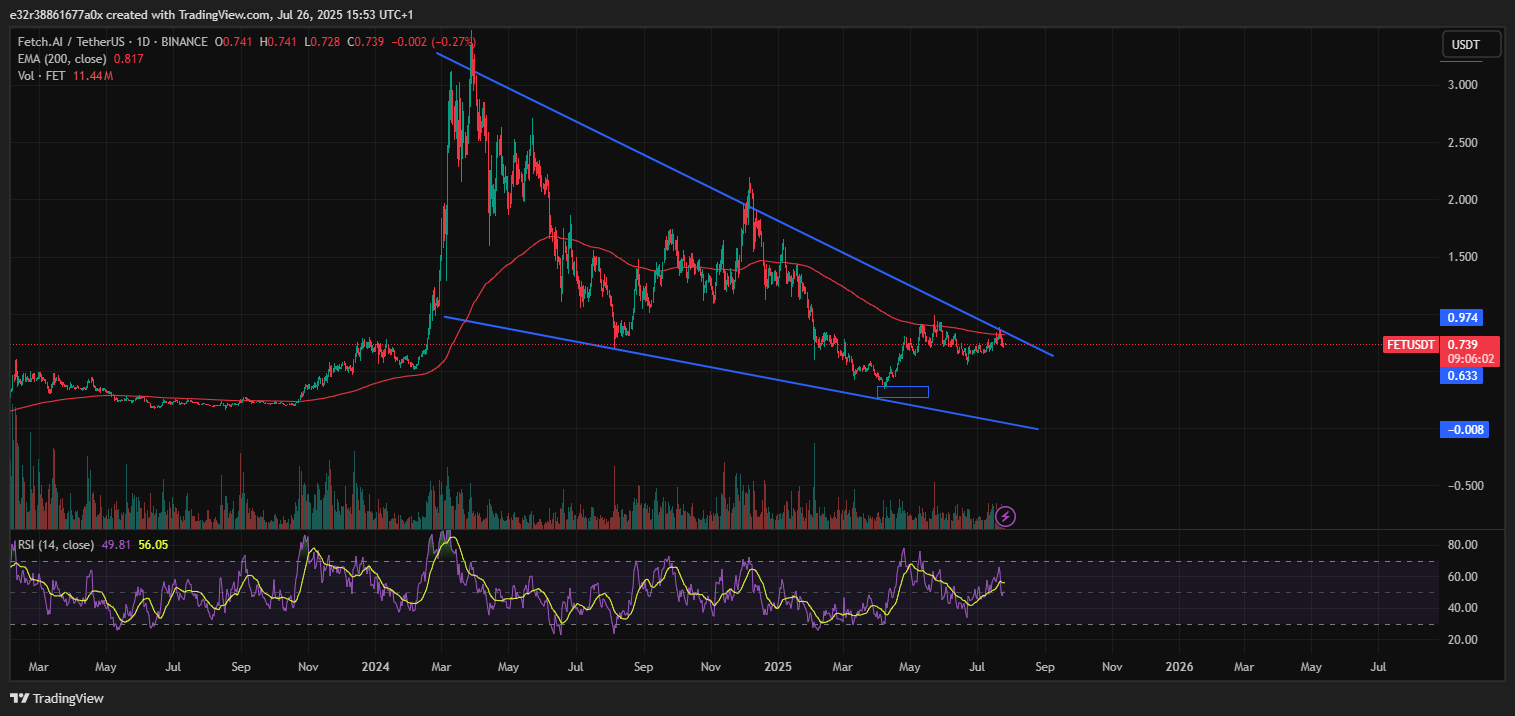
The RSI on the daily charts indicates a reading of 49.26, which is a perfectly neutral formation. In other words, the bulls and bears await the trigger to determine what comes next for FET. This is where analyst opinions come in.
Analysts Offer Opinions
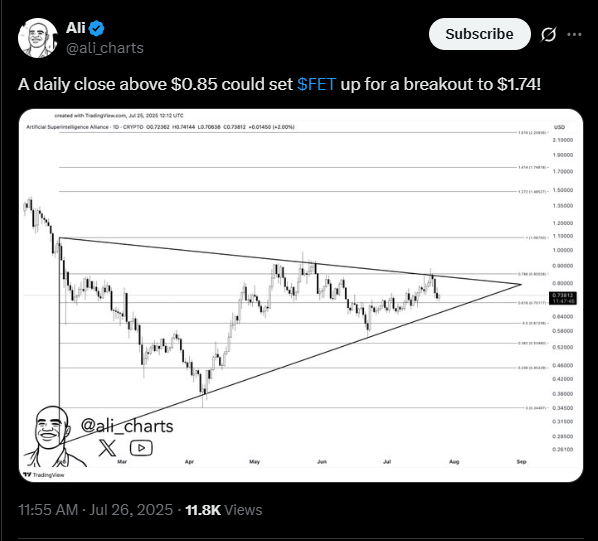
According to insights from renowned analyst Ali Martinez, the trigger for FET is around $0.85. The analyst noted that we may see a break above this price level with a daily candlestick. If this happens, FET could be on the verge of a pump towards $1.74.
Analyst MoonBoy also supports this outlook with a separate post. He mentioned FET trading within a cup and handle formation in this post. Historically, cup and handle formations tend to culminate in slow price movement to the upside, before a breakout and price explosion.
The analyst noted that FET had already formed the cup and handle. Also, it could be looking towards a push to its local peak between $2.1 and $3.5.
“If we mirror last cycle’s pattern, wave 5 by year-end could push to a new high around $4,” Solberg Invest said.
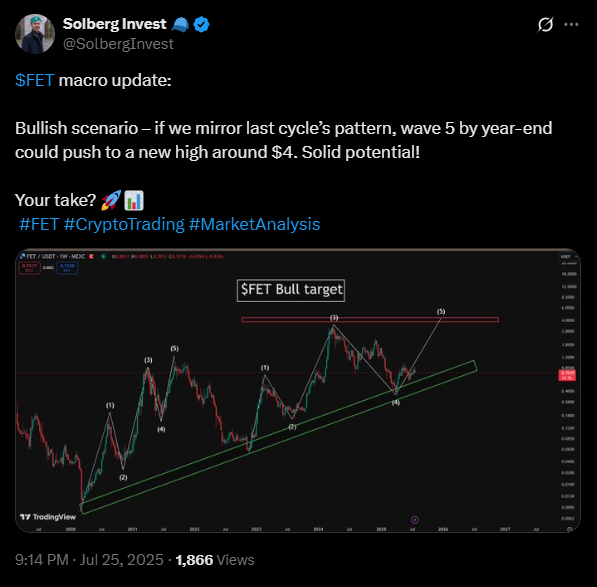
The chart attached to the post shows little to no resistance in FET’s path towards $4. Upon hitting this price target, the cryptocurrency might reverse for a retest of the multi-month ascending trendline as illustrated.
All before another rebound and push towards the upside. In all, the price action of FET depends on its ability to break $0.85 and clear the $1 price level.