


The ETH/BTC pair—a price comparison between Ethereum and Bitcoin—stands as the most-watched cross in the digital asset world. More than just two coin prices, this ratio is a real-time measure of how the second-largest crypto ecosystem stacks up against the original. For traders, analysts, and long-term investors alike, ETH/BTC provides continuous insights into technology narratives, market psychology, and shifting risk appetites. As both chains evolve, so does the meaning behind each tick of this critical pair.
Live Chart: What ETH/BTC Reveals in Real Time
A real-time ETH/BTC chart offers a window into how investors perceive the future of smart contracts versus “digital gold.” Price movements are not simply about volatility, but reflect deeper debates—development ecosystem, protocol upgrades, or regulatory postures. During periods of altcoin optimism, ETH often outperforms; in times of uncertainty, BTC dominance can surge.
Live price tracking tools, such as TradingView or Binance, show a landscape defined by sharp surges and sudden reversals. For instance, Ethereum’s outperformance during the 2021 “DeFi summer” pushed ETH/BTC to multi-year highs, only for the cross to retreat as Bitcoin’s narrative reclaimed center stage in subsequent market corrections.
“ETH/BTC is both a big-picture signal and a tactical opportunity—it tells you what crypto market participants are valuing at any given moment,” says Chris Kuiper, Director of Research at Fidelity Digital Assets.
So, monitoring the cross isn’t merely academic: it’s pivotal for those trading or allocating assets in the constantly evolving crypto universe.
Historical Performance and Macro Trends
ETH/BTC Cycles: Bull Runs, Bear Pullbacks
Tracking historical patterns, ETH/BTC typically follows cycles aligned with technology upgrades (like Ethereum’s transition to proof-of-stake) and wider market sentiment. Notably, when Ethereum successfully executed the Merge in 2022, some bullish momentum in the ETH/BTC pair was observed. However, not every technological leap translates directly into price action—the interplay of hype, network activity, and competing narrative arcs shapes each cycle.
Influential Events
- 2017–2018 ICO Boom: Ethereum’s rise as the foundational smart contract platform led ETH/BTC to spike, as new projects raised ETH and drove usage.
- 2020–2021 DeFi and NFT Growth: The explosion of decentralized finance and NFTs saw Ethereum usage soar, pushing ETH/BTC upwards.
- 2022–2023 Bear Market: Risk-off sentiment returned Bitcoin to investor favor, resulting in a gradual decline in the ratio.
These cycles highlight ETH’s unique ability to periodically challenge Bitcoin’s dominance, temporarily redefining risk and reward within digital assets.
Key Drivers Affecting ETH/BTC Price Movements
Network Adoption and Upgrades
Ethereum’s roadmap—from scalability solutions to protocol upgrades—plays a significant role. Major milestones like EIP-1559 and the Merge sparked renewed confidence, with on-chain data regularly cited as confirmation of heightened activity or cost efficiency, impacting the pair positively.
Conversely, delays or negative headlines—such as regulatory hurdles or high gas fees—often trigger traders to rotate back into BTC, favoring its perception as a safe-haven even within the crypto sector.
Market Sentiment and Macro Forces
Beyond protocol-specific changes, global factors like monetary policy, risk sentiment, and institutional adoption affect the pair. During broad crypto rallies, ETH/BTC often climbs as investors seek higher beta exposure; in market downturns, BTC’s relatively lower volatility ensures it regains share.
Some institutional reports now factor ETH/BTC trendlines into asset allocation decisions, underscoring its growing importance as a crypto-native benchmark.
Real-World Example: DeFi and NFT Surges
In practice, the summer of 2021 illustrates how surging DeFi total value locked (TVL), and NFT volumes gave ETH/BTC a boost. Analysts noted that new protocols—built primarily on Ethereum—attracted investment flows directly into ETH, with noticeable, though sometimes short-lived, outperformance relative to BTC.
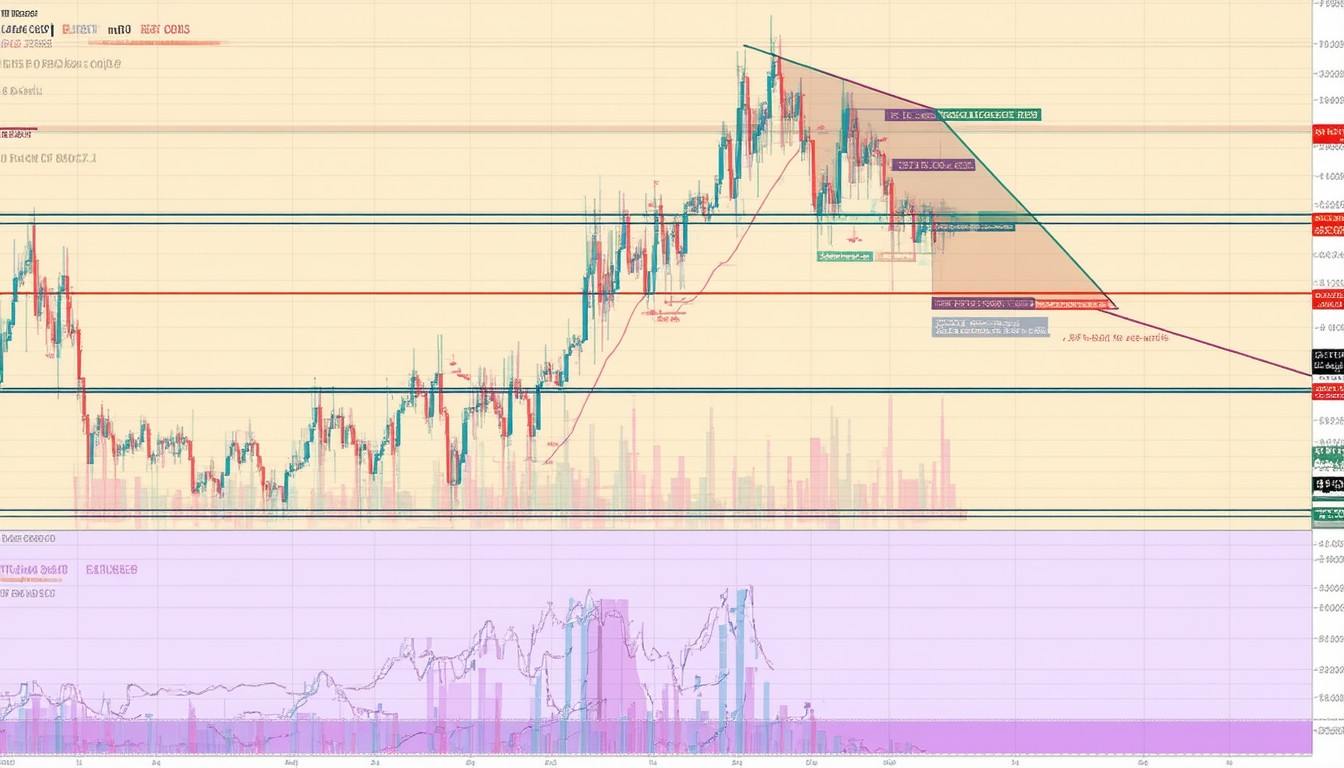
ETH/BTC Technical Analysis: Indicators and Chart Patterns
Support and Resistance Levels
Technical traders watch for clear bands where ETH/BTC repeatedly bounces (support) or reverses (resistance). These levels, visible on charts, have often corresponded with psychological milestones and major upgrade periods.
Moving Averages and Momentum
Simple and exponential moving averages (SMA/EMA) on 50-day, 100-day, and 200-day bases are especially prominent in ETH/BTC analysis. Crossovers between these averages can foreshadow momentum shifts; sustained breaks above long-term averages typically point to periods of outperformance.
Relative Strength Index (RSI) and MACD
Oscillators like RSI or MACD provide additional color, particularly for shorter time frames. Extended readings may signal overbought or oversold conditions, often preceding reversals in the ETH/BTC trend.
Example Chart Setups
- Ascending Channel: Suggests persistent ETH strength when supported by volume.
- Descending Wedge: A potential reversal setup, often preceding periods where ETH regains lost ground.
Technical frameworks are always subject to macro overlay—geopolitical developments, fiat liquidity shifts, or cross-market shocks can overpower chart setups, reminding users that analysis is both art and science in the crypto space.
ETH/BTC Forecast: What’s Next?
Short- and Medium-Term Outlook
Forecasting ETH/BTC remains a data-driven mix of technical signals and narrative interpretation. Presently, Ethereum faces questions around scaling and Layer 2 adoption, while Bitcoin benefits from inflows due to spot ETFs and its “digital gold” positioning. These competing forces could see ETH/BTC trade in a broad range, marked by sharp reactions to both network innovations and regulatory developments.
Long-Term Scenarios
If Ethereum’s roadmap continues to deliver on lower fees and broader adoption—across DeFi, NFTs, and gaming—the pair could revisit higher levels. Conversely, if “flight to safety” dominates or if Bitcoin’s institutional acceptance grows significantly faster, BTC’s relative dominance could persist.
Key factors for future moves include:
- Progress on Ethereum’s scalability upgrades (Danksharding, L2 integration)
- Shifts in regulatory clarity for smart contracts and DeFi protocols
- Bitcoin’s store-of-value narrative and macro hedge positioning
Some industry voices maintain a nuanced outlook:
“The ETH/BTC ratio is essentially a reflection of crypto’s internal tug-of-war. For tech-centric cycles, ETH can lead, but in times of stress or uncertainty, the market tends to return to Bitcoin as a baseline asset,” explains Clara Medalie, Research Director at Kaiko.
Conclusion: Strategic Insights for Traders and Investors
ETH/BTC stands apart as both a tactical trading vehicle and a strategic allocation signal. Understanding its underlying drivers—fundamental adoption, technological upgrades, market sentiment, and broader financial conditions—enables market participants to act with greater context and nuance. Careful monitoring of chart setups, ecosystem metrics, and real-time sentiment can unlock opportunity, whether the cross is trending or range-bound.
For both new entrants and seasoned professionals, ETH/BTC remains a vital compass for decoding the crypto market’s priorities and power shifts.
FAQs
What does the ETH/BTC pair represent?
The ETH/BTC ratio measures the market value of Ethereum in terms of Bitcoin, offering a real-time glimpse into comparative investor sentiment, utility, and risk appetite between the two dominant cryptocurrencies.
Why does ETH sometimes outperform BTC?
Ethereum often leads during periods of technological excitement or when DeFi and NFT activity surges, drawing capital into its ecosystem. These cycles tend to favor ETH as the preferred asset for innovation-related growth within crypto.
How do macroeconomic events affect ETH/BTC?
During global uncertainty or bearish market conditions, Bitcoin’s safe-haven image can cause it to outperform, pushing the ratio lower. Bullish or risk-on environments tend to benefit ETH, narrowing or reversing that trend.
What technical signals are most relevant for ETH/BTC analysis?
Traders frequently use support/resistance zones, moving averages, and momentum oscillators like RSI or MACD to interpret potential shifts in the ETH/BTC pair. These tools help gauge both short-term and longer-term trend strength.
Can ETH/BTC forecasting be reliable?
While forecasts can provide useful frameworks, the inherent volatility of crypto and the rapid pace of innovation mean that ETH/BTC projections are always subject to uncertainty and changing narratives.
Is ETH/BTC relevant for long-term investors?
Yes, as it helps inform decisions about portfolio allocation, risk exposure, and entry points relative to major shifts in technology and market sentiment across the crypto ecosystem.


Leave a comment