


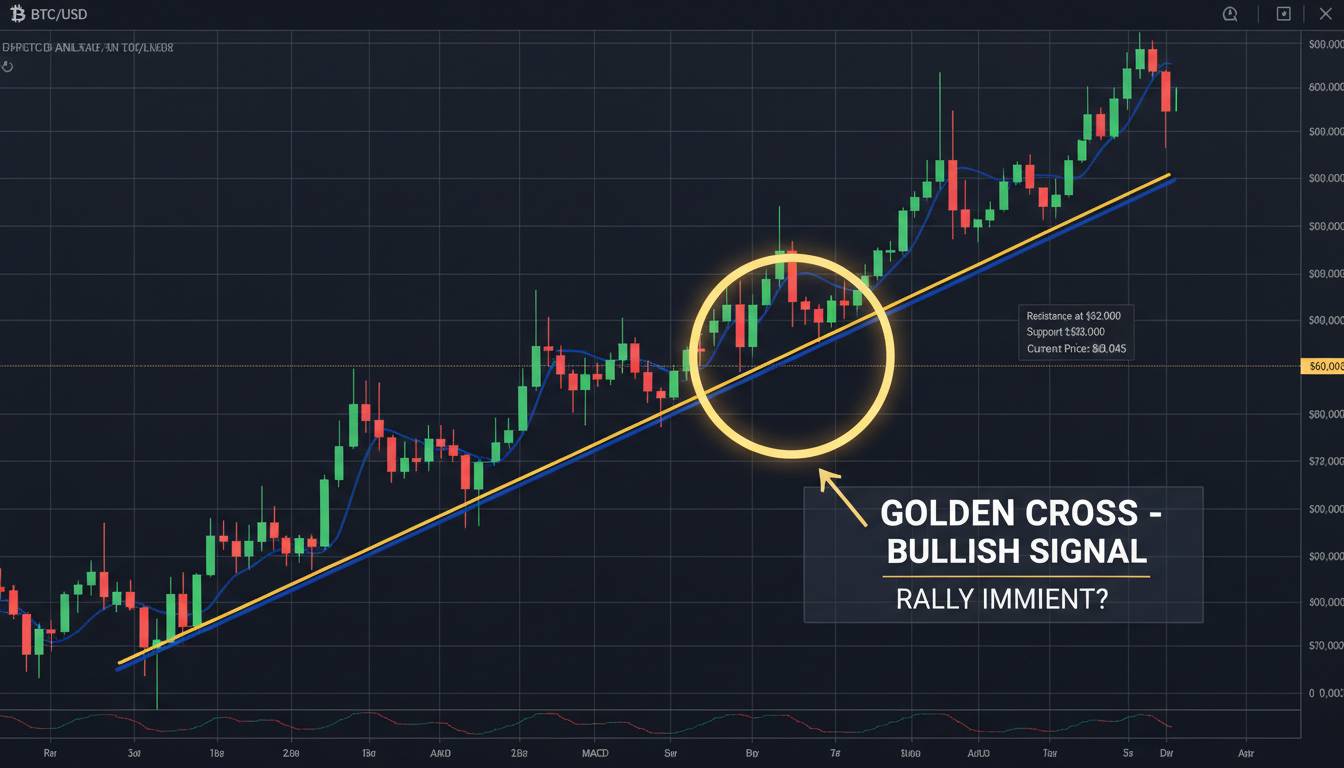
Bitcoin is back at a pivotal moment after a closely watched on-chain indicator flashed a bullish “golden cross,” reviving debate over whether the market is setting up for another leg higher or merely staging a temporary rebound. The signal comes after a volatile start to 2026, with Bitcoin falling sharply from earlier highs before stabilizing near key support levels. Recent market commentary tied the move to CryptoQuant’s Inter-Exchange Flow Pulse, or IFP, which turned positive in early March, while broader sentiment remains split because ETF flows and macro conditions still look mixed.
Bitcoin Price at Critical Turning Point as IFP Golden Cross Signals Possible Rally
The latest focus on Bitcoin stems from a March 6 market note cited by crypto.news, which said CryptoQuant contributor RugaResearch identified a bullish crossover in the Inter-Exchange Flow Pulse. The report described the move as the first time in roughly a year that the metric crossed into a more constructive zone, a development that has historically appeared near the early stages of bullish cycles since 2016.
The IFP is designed to track Bitcoin flows between spot and derivatives venues. In simple terms, analysts use it to gauge whether capital is rotating in a way that supports risk-taking and leveraged positioning, or whether activity is fading. A “golden cross” in this context does not guarantee a rally, but it is often interpreted as a sign that market structure is improving after a correction.
That matters because Bitcoin has spent much of early 2026 in a fragile technical position. CryptoQuant-related reporting in February said the asset had fallen below its 365-day moving average for the first time since March 2022, a sign that some analysts viewed as evidence of a broader downtrend. At the same time, other market observers argued that oversold conditions and improving on-chain signals could support a rebound if buyers defend major support zones.
For traders, the phrase “Bitcoin Price at Critical Turning Point as IFP Golden Cross Signals Possible Rally” captures that tension. The market is not simply choosing between bullish and bearish narratives. It is weighing whether a historically constructive signal can overcome weak capital inflows, uneven institutional demand, and a macro backdrop that still influences crypto risk appetite.
Why the IFP signal is drawing attention
Technical signals attract attention in Bitcoin because the asset often moves in powerful cycles, and early confirmation tools can shape positioning across spot, futures, and ETF-linked strategies. In this case, the IFP golden cross is notable because it follows a period of heavy uncertainty, including concerns about exchange selling, whale activity, and slowing momentum after the market’s earlier surge.
According to CryptoQuant-related coverage, similar IFP crossovers have often appeared near the beginning of stronger phases in prior cycles. That historical pattern is one reason bullish traders are watching the metric closely. However, historical analogies in Bitcoin are never perfect because each cycle unfolds under different liquidity conditions, regulatory settings, and institutional participation levels.
Another reason the signal matters is timing. March has historically been one of Bitcoin’s stronger months on average, according to market commentary citing CoinGlass data. That seasonal tendency does not determine price action on its own, but it can reinforce bullish conviction when paired with improving technical or on-chain readings.
Still, analysts remain cautious. According to Ki Young Ju, CryptoQuant’s chief executive, Bitcoin could trade sideways in the first quarter of 2026 as capital inflows slow and investors rotate toward traditional assets such as stocks and gold. That view suggests the IFP signal may be constructive without necessarily triggering an immediate breakout.
Price levels and market context
Bitcoin’s exact price has remained volatile in recent sessions, but multiple market reports place the asset in the low-$70,000 range in early March after a deeper correction from earlier 2026 highs. One report said Bitcoin was testing the $70,000 level on March 6, while another noted that the market had recently climbed back above $73,000 during a relief move. Separate reporting from earlier in the year also referenced a push above $91,000, underscoring how wide the recent trading range has been.
That broad range is important for understanding the current setup:
- Near-term support: around $70,000, a level several analysts have flagged as psychologically and technically important.
- Bearish risk zone: some CryptoQuant-linked commentary has warned that a deeper decline toward $60,000 to $70,000 remained possible if weakness persisted.
- Recovery scenario: bullish traders are looking for confirmation that Bitcoin can hold support and build momentum after the IFP crossover.
The wider market backdrop also remains mixed. Spot Bitcoin ETF demand, which was a major driver in earlier periods, has shown signs of cooling in 2026. The Block reported last month that U.S. spot bitcoin ETFs had shifted from being net buyers a year earlier to net sellers in 2026, reducing holdings by roughly 10,600 BTC. That change matters because ETF flows have become one of the clearest gauges of institutional demand in the U.S. market.
Bullish case versus bearish case
The bullish argument is straightforward. A historically constructive on-chain signal has appeared after a sharp correction, suggesting the market may be transitioning from distribution to renewed accumulation. If Bitcoin holds major support and derivatives activity remains healthy, traders could interpret the IFP golden cross as an early sign that the next upward phase is beginning.
Supporters of that view also point to Bitcoin’s tendency to recover quickly once sentiment becomes overly negative. Oversold readings, improving structure, and the asset’s history of strong rebounds after deep pullbacks all strengthen the case for a rally if macro conditions stabilize. Some market commentary has also highlighted a pending or improving golden-cross setup on moving averages, adding another layer of technical optimism.
The bearish case is equally clear. A single indicator rarely overrides deteriorating liquidity or weaker institutional participation. CryptoQuant-linked analysis in recent weeks has warned that Bitcoin’s broader market regime still looks fragile, with some measures remaining bearish and capital flows not yet showing the kind of strength that typically supports a sustained breakout.
There is also the risk that the current move is a relief rally rather than the start of a new trend. In that scenario, Bitcoin could bounce on technical optimism, fail to attract enough follow-through buying, and then retest lower support levels. That possibility is why many traders are treating the current setup as a confirmation phase rather than a definitive turning point.
What it means for investors and the broader crypto market
For short-term traders, the IFP golden cross is a signal to watch, not a guarantee. It may justify closer attention to momentum, derivatives positioning, and support-resistance behavior over the coming days and weeks. A sustained move higher would likely improve sentiment across the broader digital-asset market, especially for large-cap tokens that tend to follow Bitcoin’s lead.
For longer-term investors, the bigger question is whether Bitcoin can reestablish a durable uptrend after its early-2026 correction. That depends on more than chart patterns. ETF flows, macro liquidity, interest-rate expectations, and the willingness of institutions to reengage all remain central to the outlook.
According to Ki Young Ju, the near-term market may remain subdued even if some technical signals improve. That view reinforces a broader lesson in crypto markets: bullish indicators can appear before fundamentals fully recover, but they can also fail if the macro environment does not cooperate.
Conclusion
Bitcoin is at a genuine inflection point. The IFP golden cross has given bulls a credible reason to argue that the worst of the recent correction may be over, especially because similar signals have historically appeared near the start of stronger phases. Yet the broader backdrop remains uncertain, with ETF demand softer than a year ago and several analysts still warning that the market has not fully escaped downside risk.
For now, “Bitcoin Price at Critical Turning Point as IFP Golden Cross Signals Possible Rally” is an accurate description of the market’s state. The signal is real, the opportunity is visible, and the risks are still substantial. Whether this becomes the foundation for a fresh rally or another false dawn will depend on how Bitcoin behaves around key support levels and whether capital returns to the market in a sustained way.
Frequently Asked Questions
What is the IFP in Bitcoin analysis?
The IFP, or Inter-Exchange Flow Pulse, is an on-chain indicator used to track Bitcoin flows between spot and derivatives exchanges. Analysts use it to assess whether market structure is becoming more supportive of bullish positioning.
What does a golden cross signal mean?
A golden cross generally refers to a shorter-term trend measure crossing above a longer-term one, which traders often interpret as a bullish shift in momentum. In the IFP context, it suggests improving market conditions rather than a guaranteed price surge.
Is Bitcoin definitely about to rally?
No. The signal is bullish, but several analysts still see risks tied to weaker capital inflows, softer ETF demand, and broader macro uncertainty.
Why is $70,000 important for Bitcoin?
Recent market reports have identified the $70,000 area as a key support zone. Holding above that level could strengthen the bullish case, while losing it may reopen downside risk.
How do ETF flows affect Bitcoin price?
Spot Bitcoin ETFs have become a major source of institutional demand in the U.S. When inflows are strong, they can support price momentum; when flows weaken or turn negative, they can reduce buying pressure.
What should investors watch next?
Investors are likely to focus on whether Bitcoin can hold support, whether ETF flows improve, and whether on-chain strength broadens beyond a single indicator. Those factors will help determine whether the current signal develops into a sustained rally.


Leave a comment