


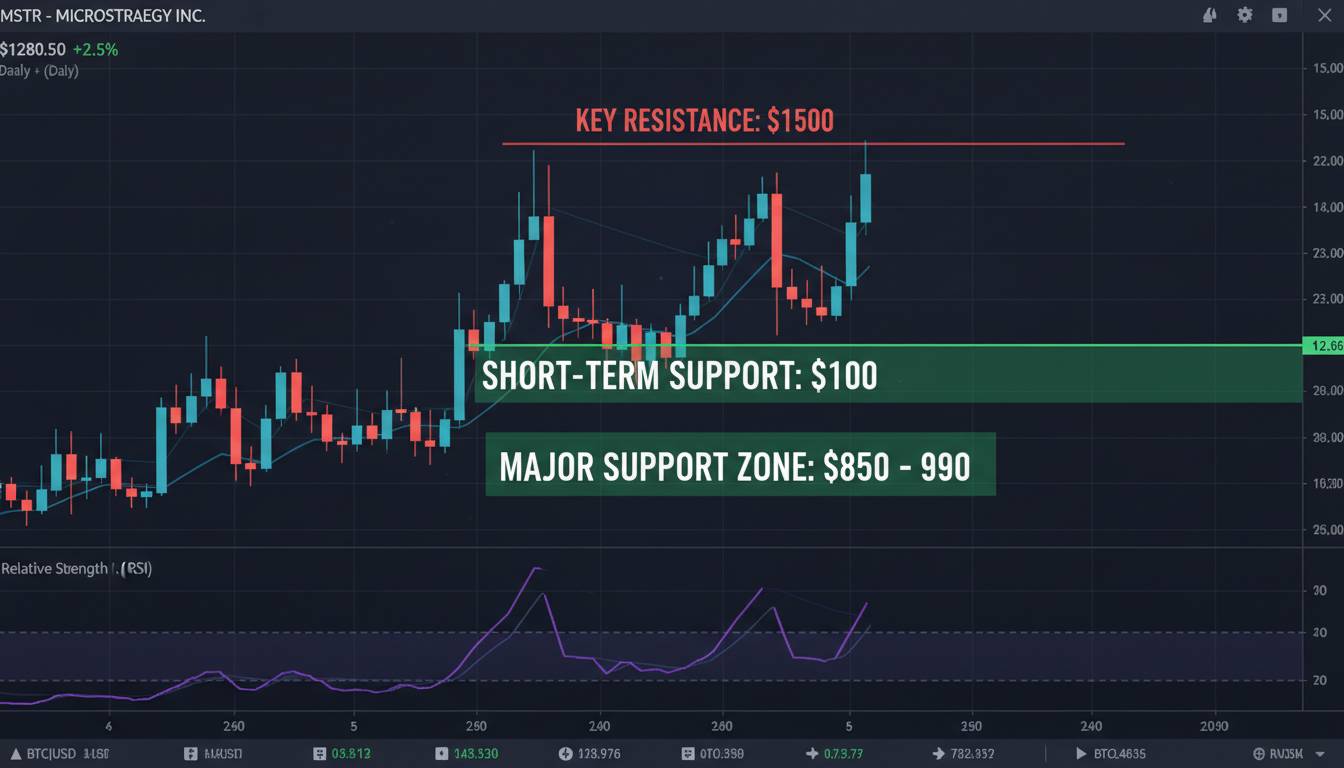
MicroStrategy (ticker: MSTR) is currently trading around $123, offering a clearer picture of its short-term technical landscape. Key levels to watch include support near $130–$133, with notable resistance levels clustered around $147, $226, and $304, based on recent moving average data. Short-term indicators suggest mixed momentum, while long-term sentiment leans bearish. Let’s dig into what these levels and signals mean for investors.
Current Technical Sentiment and Moving Averages
Technical signals for MSTR reveal a cautious bias overall. TipRanks reports a negative technical sentiment, with the stock trading below key moving averages—including the 50-day (~$165), 100-day (~$226), and 200-day (~$304)—indicating downside pressure and signaling that upside momentum has cooled.
Meanwhile, Investing.com confirms this mixed picture: shorter-term moving averages (5-day through 50-day) trend positive, while the 100- and 200-day averages suggest a bearish longer-term outlook.
What this means:
- Short-term: some bullish momentum is present, hinting at a possible small bounce.
- Long-term: MSTR needs to break above the 100–200-day ranges ($226–$304) to shift out of its broader downtrend.
Key Support and Resistance Levels
Here’s a look at important price zones shaping investor behavior:
Support Levels
- $130–$133: Pivot zone supported by moving average crosses and pivot computations.
- $103–$104: Represents 50% retracement from recent highs and lows—an area where buyers may regroup.
Resistance Levels
- $147–$165: Marked by 50- and 100-day moving averages—key hurdles for price recovery.
- $226: 100-day moving average—strong resistance among longer-term gauge tools.
- $304: 200-day moving average—major barrier for sustained bullish reversal.
Momentum Indicators and Signal Interpretation
A quick glance at individual indicators:
- RSI (14-day): Ranges from mid-30s to upper 50s—neutral to slightly oversold.
- MACD: Slightly negative in the long term, yet short-term MACD shows some bullish hints.
- Stochastic Oscillator: Very low readings point toward oversold conditions—potential for a short-term bounce.
These mixed indicators suggest that while MSTR isn’t flashing strong buy signals, it’s not trending decisively lower either—it’s a cautious equilibrium.
Real-World Context and Analyst Views
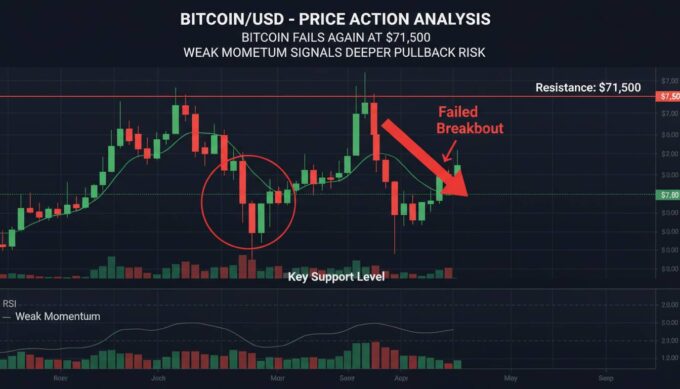
The stock’s price swings often mirror Bitcoin’s fortunes. Citi highlights that MSTR acts like a leveraged Bitcoin play: heavy gains when BTC rises, sharp losses when it falls. Their $485 price target assumes Bitcoin climbs to $181K.
TipRanks estimates a 12-month target near $412, signaling an implied upside—but that requires a shift in momentum and sentiment.
Quick Summary Table
| Metric | Value / Insight |
|—————————|———————————————-|
| Current Price | ~$123 |
| Key Support | $130–$133; next layer at $103–$104 |
| Key Resistance | $147–$165; $226; $304 |
| Short-term Indicators | Mixed; slight bullish hints, oversold risks |
| Long-term Trend | Bearish, below key moving average levels |
| Market Context | Highly tied to BTC performance |
| Analyst Sentiment | Bullish targets if Bitcoin rallies |
Summary
MSTR is juuuuust sitting in a tricky zone. Short-term signals give a sliver of hope—but long-term trends still favor the bears. Support around $130–$133 is crucial; if that breaks, we could see a slide toward $100. A sustained breakout hinges on climbing past $165 and eventually $226. MicroStrategy’s fate remains closely linked to Bitcoin, adding another layer of complexity.
For now, investors should watch those pivot zones, be cautious, and wait for clarity before leaning into big positions.
FAQs
What’s the most important level for MSTR to hold in the near term?
The $130–$133 range is critical—it’s where short-term buyers may step in. If that fails, the stock could drift toward $100.
Does MSTR look oversold or ready for a rebound?
Technicals are mixed. Some indicators like the Stochastic point to oversold conditions, but overall momentum remains muted, so any bounce may be limited.
When could MSTR start trending higher?
For a sustainable bullish move, MSTR needs to breach key resistance levels at $147–$165. Any clear breakout above $226 would suggest a stronger trend shift.
How much does Bitcoin influence MSTR’s outlook?
Tremendously. Analysts like Citi expect MSTR to rise significantly only if Bitcoin rallies. A decline in Bitcoin often drags MSTR lower too.


Leave a comment