


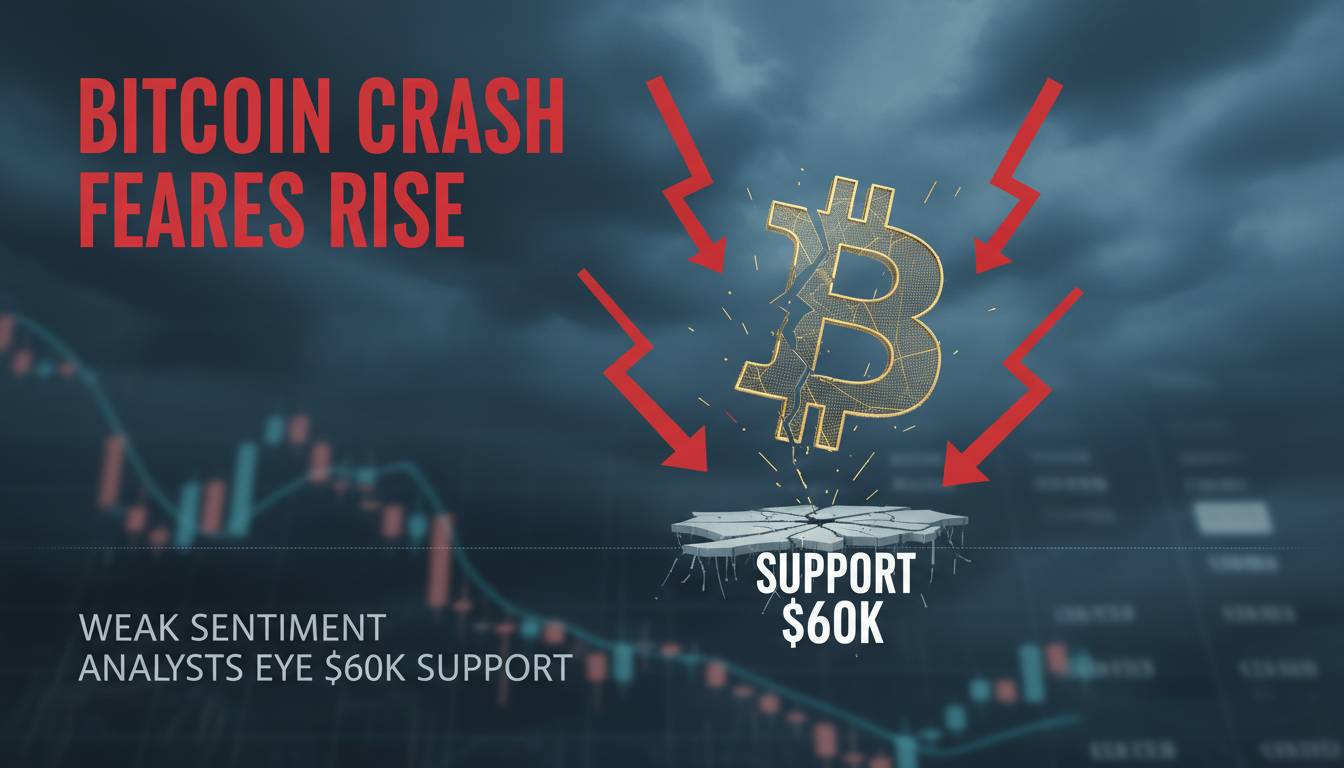
A Sudden Crash and Dismal Sentiment
Bitcoin recently crashed to around $60,000, marking its largest one-day drop since 2022 and wiping out over a dozen months of gains—around a 38% decline from its early-2026 high near $97,000 . At the same time, the Crypto Fear & Greed Index has plunged to record lows—scoring a mere 7 to 9 out of 100—indicating near “extreme fear” among investors, a level not seen since the Terra (Luna) collapse in mid‑2022 .
That combination of steep losses and frayed nerves may set the stage for a dramatic recovery—or a deeper drop.
Technical Tension: Is $60K Holding?
On the technical side, $60,000 aligns with critical indicators. Analysts point to Bitcoin’s 200-week moving average (roughly around $58K) and the realized price (near $56K) as long-term support zones .
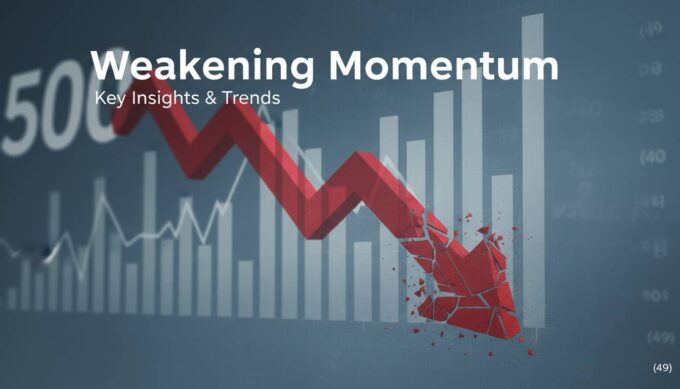
However, weak on‑chain signals persist. Derivatives markets reveal intense selling: options skew and futures basis rates reflect deep pessimism . And analysts Spot Bitcoin trading well below its 50- and 200-day moving averages confirms a slowing trend .
Kaiko Research views this drop as potentially marking the “halfaway point” of the current bear cycle, though they warn that deeper declines toward $40K–50K remain plausible if historical retracements play out .
Contrarian View: Could $60K Be the Bottom?
Not everyone sees $60K as just a floor—and some say it’s already a temporary bottom. Analyst Michaël van de Poppe highlights extreme oversold RSI levels (dipping to around 15) and historic sentiment patterns—reading like past market nadirs .
Liquidation data offers a hopeful twist. If Bitcoin climbs above $70K, over $5.5 billion in short positions could be forced to cover, potentially triggering a sharp rally .
That said, absent renewed spot demand, the recovery could fizzle—derivatives markets still show dominance of short selling and structural pressure remains .
What Analysts Are Saying
-
Compass Point’s Ed Engel sees a risk of Bitcoin retesting $60K and potentially moving to $55K–$60K. Yet he considers a sustained break below those levels unlikely, given the convergence of the average purchase price (~$56K) and the 200‑day moving average (~$58K) .
-
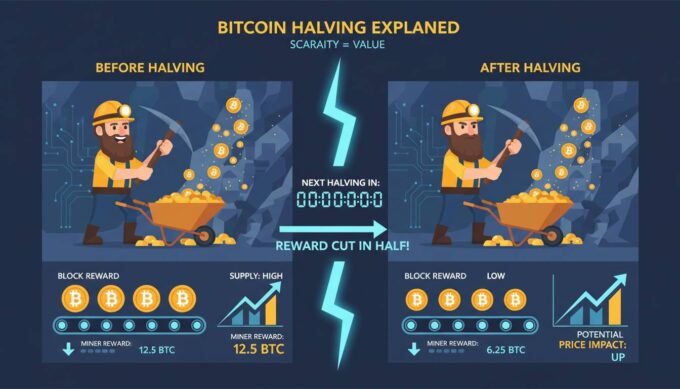
Kaiko Research suggests the current crash may be the midpoint of a bear market. They note the decline has followed the 2024 halving and flag on‑chain signals and futures volume as key to gauging the cycle’s integrity .
-
Galaxy Research’s Alex Thorn recommends watching the $56K–$58K zone, citing it as a historical accumulation area. Bitwise’s Matt Hougan points to solid fundamentals behind the scenes—like growing stablecoin use and crypto tokenization—as tailwinds .
“With oversold indicators emerging on multiple timeframes, the rebound conversation around BTC is more a question of when, not if.” — Shawn Young, Chief Analyst, MEXC Research
Why the Market Reacted This Way
Several macro and structural factors drove the crash:
- A steep sell-off in US tech stocks and concerns about an AI bubble rattled crypto-linked confidence .
- Weakening US labor market data—especially rising unemployment claims—heightened risk aversion, undermining hopes for cut‑friendly Fed policies .
- Massive liquidations followed: more than 588,000 traders lost positions amounting to $2.7 billion, with 85% representing leveraged long trades .
These triggers produced a classic panic spiral—but also created conditions sometimes associated with forced bottoms.
Looking Ahead: Reaction or Recovery?
Here’s what to watch:
Support Validity
– Can $60K–$58K areas hold? A firm close above here may stabilize sentiment.
Lighting a Spark
– Short-liquidation surges (e.g., the $5.5B potential above $70K) could initiate rapid upward moves .
Macro Signals
– A rebound in tech stocks, crypto regulation clarity, or renewed institutional demand—like until recently seen from Strategy/SAFU’s accumulation—could shift tone toward recovery .
On‑chain Trends
– Metrics like futures open interest, realized trading volume, and holder behaviors (long vs. short‑term) will indicate whether buying or selling dominates .
Conclusion
Bitcoin’s recent crash to ~$60,000 amid the steepest plunge in years is triggering alarm—and triggering hope—in equal measure. Sentiment has tumbled into “extreme fear” territory unseen since 2022, and technicals now straddle critical supports near the low‑$60Ks. Analysts are torn between a bounce (triggered by forced buying and contrarian sentiment) and further downside—possibly down to $40K–$50K—if the bear market continues.
The story now pivots on whether technical support holds and buyers step in convincingly. For long-term observers, patience and clarity on the macro and on‑chain metrics will guide whether this becomes the cycle’s real bottom—or just an ominous pause.
FAQs
Will Bitcoin definitely bounce at $60K?
Not necessarily—it’s a key support level both psychologically and technically, but requires real demand to stick. Weak volume and continued derivatives selling could still push it lower.
Are we headed back to $40K?
Possible. Historical retracements often reach 60–70% from highs, suggesting levels near $40K–$50K if bearish patterns continue .
Can sentiment alone spark a rebound?
Extreme fear may lay groundwork for a bounce, especially if it prompts short covering. But sentiment needs supportive fundamentals or technicals to convert into a durable rally.
Is this the start of a bear market?
Indicators point toward deeper correction—breaches of the 200-week EMA and structural on‑chain trends suggest a longer drawdown rather than a short dip .
What could turn things around?
A surge in institutional buys, macro stabilization (like tech sector recovery), or signal shifts on-chain (e.g., rising open interest or accumulation) could catalyze a recovery.
Should investors buy the dip now?
Timing matters. Some see a generational opportunity here, others warn of further risks. Looking for confirmation via volume and macro cues may guide smarter entry.


Leave a comment