


Quick Answer
Litecoin’s trend strength is currently moderate-to-bullish. It’s holding a long-term bullish channel, showing improving momentum indicators, and approaching key resistance zones. That suggests a potential breakout if volumes hold—though overbought signals and macro risks warrant caution.
Structural Support and Long-Term Trend
Litecoin has stayed in an ascending channel for years—a sturdy foundation since 2020. As of December 2025, price action was near the lower edge, which historically attracts buyers—and that textured channel gives it a long-term directional anchor.
Adding to that, a bullish pennant had formed, hinting consolidation before climbing again. A sustained close above the $100–$115 region could validate a move toward $160–$300 based on structural patterns.
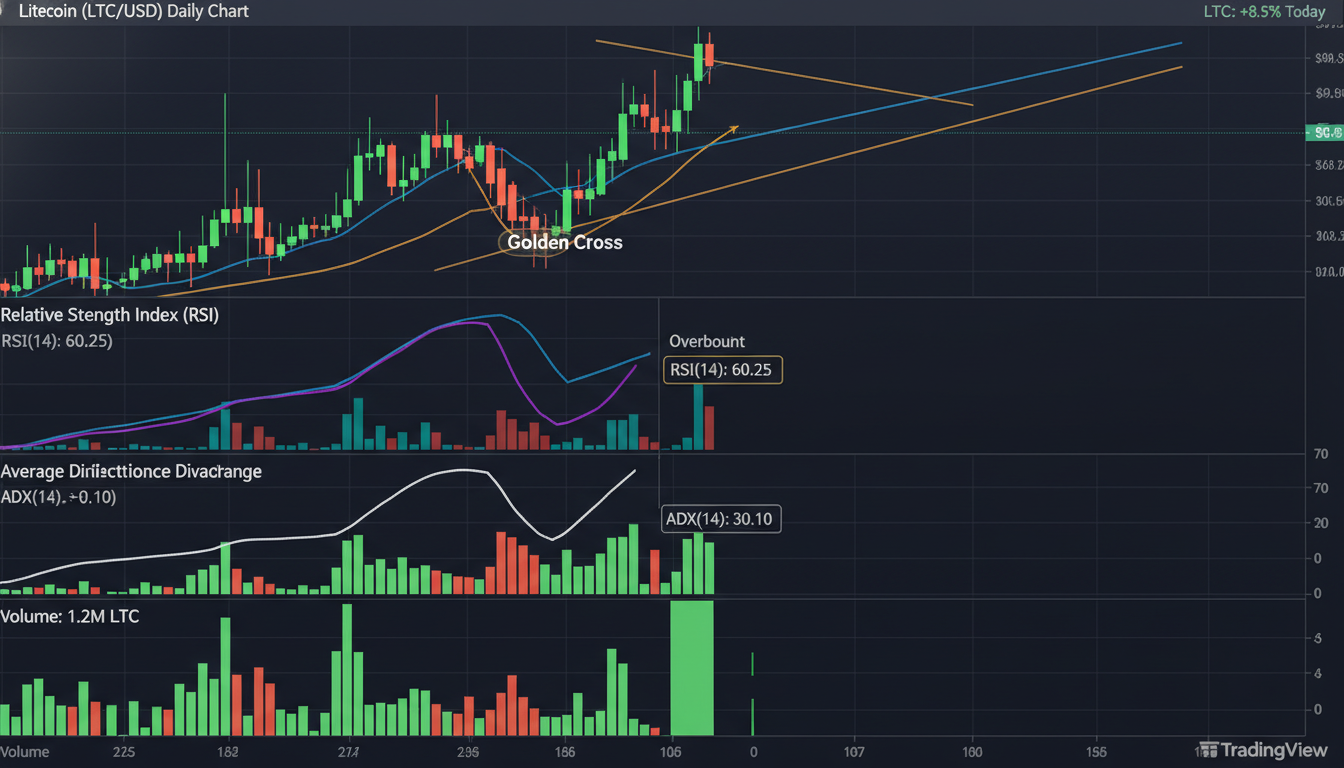
Momentum tools support the bounce too—RSI is above 50, MACD is improving—suggesting bullish bias without yet entering overbought extremes.
Momentum Indicators & Short-Term Strength
As of early October 2025, LTC was 20% above its 200-day moving average, with solid gains above both the 20-day and 200-day SMAs. RSI was near 60.1, offering room to grow, and MACD showed a bullish histogram. That’s technical strength across timeframes, reinforcing a favorable risk/reward setup.
Volume was steady, too, hinting that institutional and retail interest remained supportive above key levels (~$115–$120).
Resistance and Breakout Potential
However, LTC faces meaningful resistance zones—historical ceilings near $120–$135 must be cracked before higher targets become realistic. Analysts have called out these levels as crucial for confirming sustained bullish momentum.
That said, earlier models projected breakout targets like $150–$160, and optimistic patterns pointed as far as $280 or even $386, though these rely on very strong trend continuation.
Near-Term Caution: Indicators & Overbought Alerts
On the flip side, some forecasts warned of overbought conditions in mid-2025. For instance, RSI and Stochastic readings on key timeframes suggested short-term pullback risk even amid bullish setups.
Similarly, a 24-hour analysis in late October 2025 showed RSI near 77.8 and a MACD decline—signalling exhaustion despite price gains. That highlights caution for momentum traders looking at short-term plots.
Fundamental Developments & Broader Context
Litecoin isn’t just charts—its fundamentals are shifting. Its 88% correlation with Bitcoin means BTC’s moves remain a big influence.
Network fundamentals are solid: hash rate hits all-time highs, and transaction volume has been strong.
Key upgrades are underway—LitVM, a ZK Layer‑2 for smart contracts, is in Q1 2026 testnet phase, with a mainnet rollout expected later. If developer adoption follows, LTC demand could rise.
Plus, events like the **Litecoin Summit in Amsterdam ** could drive renewed momentum if big announcements happen.
Summary Snapshot—Trend Strength
| Timeframe | Status & Notes |
|—————-|—————-|
| Long-term | Solid ascending channel, bullish pennant, positive momentum. |
| Medium-term | Resistance near $100–$115; breakout could drive toward $160+. |
| Short-term | Mixed signs—strong recent moves but overbought alerts need monitoring. |
The overall trend feels cautiously bullish—but not runaway. Watch for a close above $100–$115 as a technical trigger. Conversely, any slip below structural support should make traders consider downside scenarios near $63–$70.
Quote from an Expert
“Litecoin’s long-held bullish structure and layer‑2 upgrades position it for a trend breakout—provided technical resistance is breached and adoption deepens.”
Concluding Thoughts
Litecoin’s chart story shows resilience and potential—but patience remains key. The technical foundation is intact, and new upgrades bring fresh use-case angles. If Litecoin can clear overhead resistance with volume, next stops could be in the mid‑hundreds. But for now, trend‑strength is moderate‑to‑bullish, not explosive.
FAQs
What’s the most important level to watch right now?
Focus on the $100–$115 zone. A close above could validate bullish technical setups. Until then, resistance remains unbroken.
Could LTC fall sharply from here?
Yes, if it drops below the lower edge of its ascending channel (~$63–$67), technical damage could prompt deeper retracements.
How much does Bitcoin influence Litecoin?
Very significantly—LTC and BTC share ~88% correlation. A move in Bitcoin often drags Litecoin along.
Will upgrades like LitVM change the price outlook?
Potentially. Layer‑2 smart contract support could unlock DeFi and developer use cases, boosting demand if adoption follows.
Is Litecoin overbought now?
On short-term charts, some indicators (RSI, Stochastic) hint at overbought zones. That suggests potential for a pause or slight pullback before continuation.


Leave a comment