


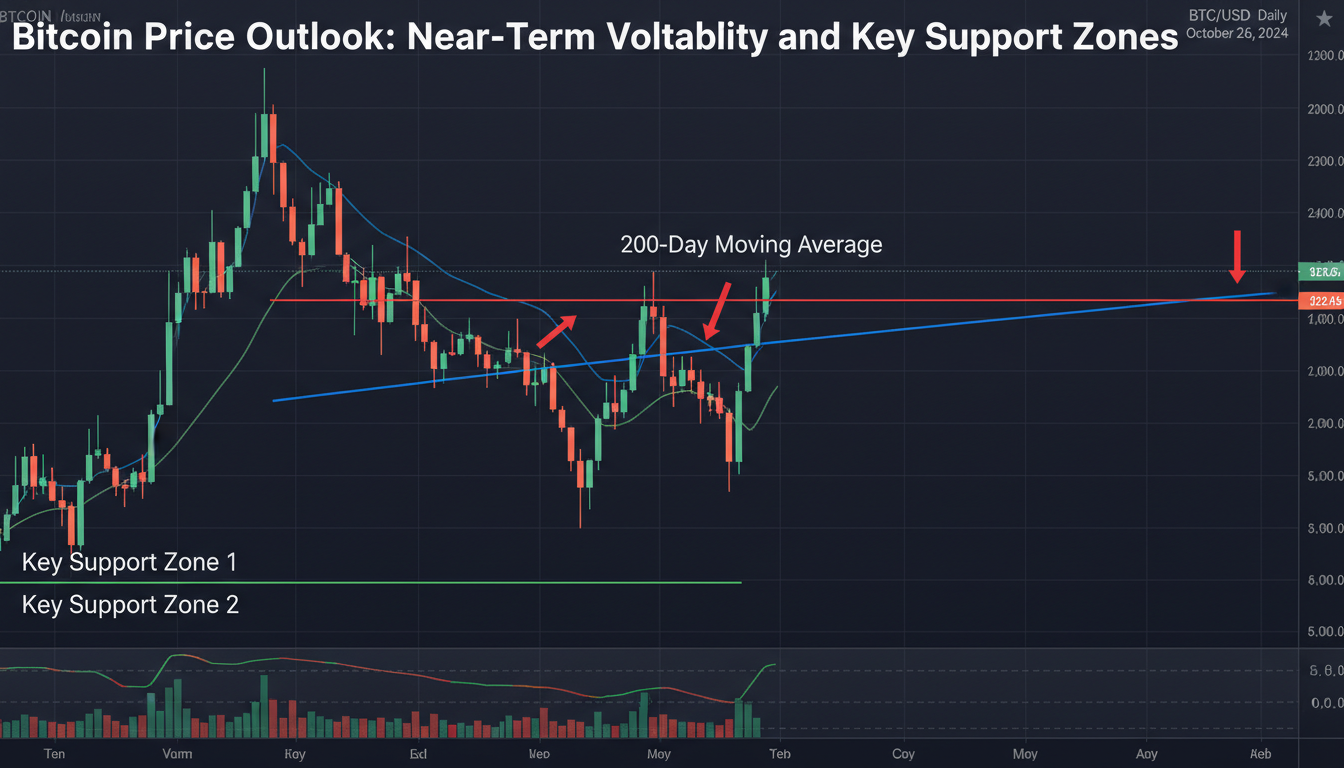
Bitcoin remains highly volatile in the near term, but key zones between $75K–$76K offer strong support, while the $80K–$83K area acts as immediate resistance. Recent price action sees Bitcoin hovering near $78K–$79K, reflecting a tumultuous tug-of-war between buyers and sellers.
Volatility and Price Context
Bitcoin’s price has swung dramatically over the past few days. It briefly dipped below $73K before clawing back above $76K, with ongoing volatility keeping the crypto market on edge . In another swing, analysts described Bitcoin entering “full capitulation mode” after falling over 12% to sub-$64K, pointing to a possible extended reset rather than just a minor correction .
This recent instability marks a ~35% decline from its optimism-fueled high near $125K–$126K in October 2025, showing how sharply sentiment can flip .
Key Near-Term Support Zones
- $75K–$76K: Held as robust multi-week support during the February dip, attracting dip-buyers .
- $72K–$74K: A deeper zone aligning with Bitcoin’s 200-week moving average, offering better structural safety .
- $70K–$72K: A psychological pivot and prior consolidation zone; a breakdown here could signal a deeper correction .
- Some bearish models point to much lower downside targets near $57K–$58K or even $38K, though these remain further outlier scenarios .
Immediate and Medium Resistance Levels
- $80K–$82K: Immediate resistance cluster, pressing against the 50-day EMA and prior support clusters .
- $85K–$88K: The next zone of resistance built by the downtrend from 2025’s peak, with some analysts eyeing $95K–$110K if bearish momentum subsides .
Technical Signals Point to Imminent Movement
A Bollinger Bands squeeze is underway between $85K–$90K, suggesting an imminent breakout—though direction remains uncertain . Historically, such compressions are followed by 15–25% moves, as explained by analyst Katie Stockton .
On shorter timeframes, RSI sits near 29–30, signaling oversold conditions that could invite relief rallies . However, bearish momentum remains prominent—MACD is negative, trend indicators remain weak, and multiple moving averages sit overhead . Overall, a short-term bounce remains plausible, but sustained upside will need investor confirmation via volume and sentiment shifts.
Risks and Alternative Scenarios
The most immediate risk lies in a failure to hold $75K, which could expose lower levels such as $70K, then down toward the 200-week moving average near $58K–$60K . Some long-term models even point to $38K in bear-market cascades .
Conversely, if Bitcoin breaks above $80K–$83K, the path toward $95K–$110K opens, driven by technical momentum and potential institutional inflows .
Expert Insight
“Historical patterns overwhelmingly show that Bollinger Bands squeezes of this magnitude precede major price swings. Whether Bitcoin breaks upward or downward, the movement will likely be substantial.”
— Katie Stockton, Fairlead Strategies
That quote sums it up—Bitcoin’s next move may be big, but its direction remains to be earned by price action.
Summary Table of Key Zones
| Zone Type | Price Range | Importance |
|————————|————————|———————————-|
| Support (Immediate) | $75K–$76K | Dip-buying zone, multi-week anchor |
| Support (Deep) | $72K–$74K | 200-week MA and stronger base |
| Resistance (Immediate) | $80K–$82K | Daily/weekly ceiling |
| Resistance (Upper) | $85K–$88K | Breakout zone, psychological cap |
| Breakout Upside | $95K–$110K | Medium-term rally potential |
| Bear Case Deep | $60K–$58K, possible $38K | Extended structural support zones |
| Volatility Trigger | Narrow range near $85K–$90K | Bollinger squeeze alert |
Conclusion
Bitcoin remains trapped in dramatic swings, with $75K–$76K sitting as a crucial near-term lifeline. If that holds, a bounce up to $80K–$83K is within reach—but failure there would expose $72K–$74K, or worse. On the upside, cracking $85K–$88K could unleash bullish pressure pushing toward $95K+. With technical signals tense and sentiment split, the stage is set for a decisive move soon. Traders should watch volume and hold levels closely—momentum in either direction may unfold sharply next.
FAQs
** Why is $75K–$76K seen as a strong support zone?**
It has held repeatedly in recent trading, aligning with volume accumulation areas and prior pivot points. Dip-buyers have defended this cluster, giving it structural significance.
** What signals are traders watching for a breakout?
A narrow Bollinger Bands range below $90K** signals incoming volatility. Confirmation would come from rising RSI above neutral and bullish MACD crossovers above resistance zones.
** How risky is a break below current support?**
If $75K fails, deeper losses toward $72K–$74K are likely. Further breakdown could drive losses back to mid-$60K levels or the 200-week moving average near $58K–$60K.
** Could Bitcoin still rally above $100K soon?**
Yes, if BTC breaks and holds above $85K–$88K, technical momentum and bullish sentiment could push it toward the $95K–$110K range, with some models even targeting higher.
** Is current technical setup tilted bullish or bearish?**
Technically bearish bias dominates—MACD is negative, trend indicators stay weak. But oversold RSI and compression zones offer room for short-term relief rallies.
** What should traders monitor next?**
Focus on how Bitcoin reacts near $75K (support) and $80K (resistance). Watch for increasing volume on moves, RSI breakout above mid-level, and whether Bollinger Bands expand downward or upward.


Leave a comment