


Solana’s price outlook right now hinges on a mix of evolving technical signals that suggest both caution and opportunity. In the short term, momentum looks fragile, with key indicators like the RSI showing oversold levels and support tests near $100. But if network upgrades and institutional flows behave as expected, traction toward $180–$190 and beyond could materialize.
1. Near-Term Technical Indicators: Support, Resistance, and Sentiment
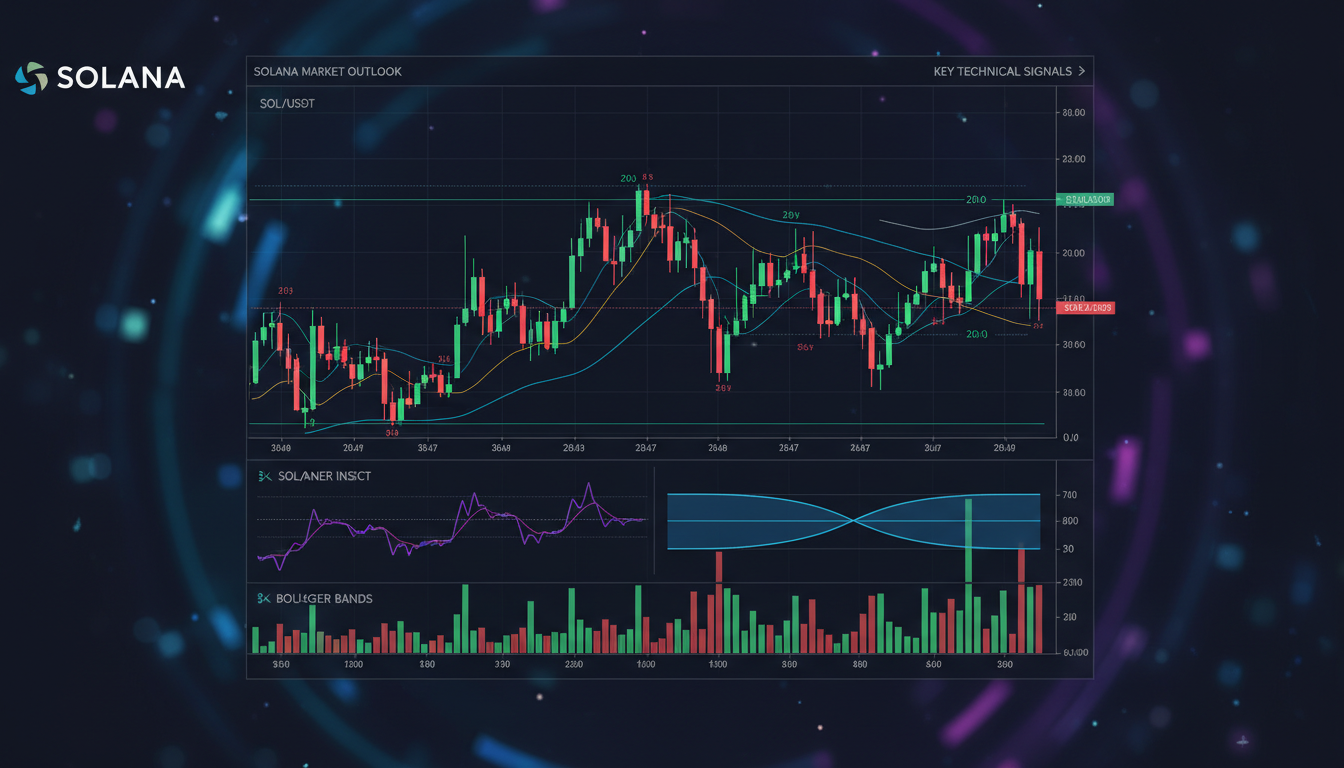
Solana’s oversold conditions are hard to ignore. CoinCodex notes the RSI sits at a low ~25–26, pointing to a potential short-term bounce, even as both 50- and 200-day SMAs project lower levels into early March, around $118 and $154 respectively . That said, support near $97–$89 remains critical—breaks below that zone could expose deeper downside .
On another front, BTCC identifies bullish signs: SOL trading above its 20-day moving average (~$126) and flirting with the upper Bollinger Band (~$135), while MACD looks less bearish and RSI sits neutrally at ~58 . That signals buyers may be gathering near short-term support.
Meanwhile, analyses on platforms like Weex still describe a bearish setup, with both the 50- and 200-day MAs trending downward and RSI holding in neutral territory .
2. Medium-Term Chart Patterns: Cup, Handle, and Institutional Flow
A compelling cup-and-handle formation seems to be forming, with measured targets pointing to the $180–$190 range—around a 25–30% upside from current levels. SOL has held above its 50-day MA since January, adding substance to the setup. RSI remains in neutral, avoiding overbought territory .
Those targets are supported by growing institutional interest, with spot Solana ETFs seeing steady inflows (from ~$1.02B to ~$1.14B year-to-date), lending structural buying support .
3. Fundamental Catalysts: Protocol Upgrades and On‑Chain Health
The Alpenglow update, designed to shorten block finality to 100–150ms, could improve Solana’s appeal for high-frequency DeFi and institutional use cases—if executed smoothly, of course . Similarly, Firedancer’s upgraded capacity and reduced latency may further reinforce SOL’s technical moat .
On-chain activity also offers reassurance: Solana dominates tokenized stock trading volumes (~99%), with weekly network fees above $1M and added accumulation from institutional players like Bitwise . These metrics paint a picture of a maturing ecosystem—not just a speculative platform.
4. Downside Risks: Structural Weakness and Macro Tailwinds
It’s not all rosy. FXEmpire warns that following a nearly 1,500% rally from 2022 lows, Solana remains vulnerable to significant mean reversion. With long-term supports broken, technical damage could drive a dip toward $40–$50 in a severe scenario .
More near-term warnings come from AI models forecasting up to a 20% drop to ~$128 in the next month on weakening momentum and volume trends . At the same time, concerns around speculative positioning and liquidations further cloud the picture .
Summary Table: Technical Outlook at a Glance
| Time Horizon | Bullish Indicators | Bearish Concerns |
|——————|—————————————————|———————————————–|
| Short Term | Oversold RSI, 20-day MA support (~$126 – $135) | Downward SMAs, risk of testing support below ~$90 |
| Medium Term | Cup & handle formation (target $180–$190), ETF inflows | Resistance at $145–$150, crowding risks |
| Long Term | Upgrades (Alpenglow, Firedancer), institutional flows | Pattern damage, potential large corrections |
A Closer Perspective: Quote from the Field
“A sustained move above $135.60 resistance could trigger upside toward the $150 psychological level,” notes a BTCC market analyst, emphasizing how key levels continue to define sentiment.
— Samir Patel, Market Strategist
Final Thoughts
Solana sits at a crossroads. Short-term, it’s navigating oversold sentiment and support tests. Structurally, the network benefits from infrastructure upgrades and solid on-chain health, providing a foundation for potential gains toward the $180–$190 zone. But risks—broken long-term supports, speculative pressures, macro volatility—mean traders and investors should stay alert.
For those with conviction in Solana’s ecosystem and roadmap, dips into the $100–$120 range might offer strategic entry points, especially if accompanied by regain above the 50-day MA. However, broader market weakness or upgrade hiccups could change the narrative fast.
FAQs
What signals a potential bounce in Solana right now?
Oversold RSI (~25–26) and holding near key support (~$97) suggest a short-term bounce could be possible, particularly if buyers support levels near the 20-day MA (~$126–$135) .
How high could SOL go if bullish patterns play out?
A completed cup-and-handle formation points to targets in the $180–$190 range. Breakouts above these could open further upside, assuming sustained ETF inflows and strong on-chain activity .
Which technical upgrades are most promising for Solana?
The Alpenglow upgrade for sub-second finality and Firedancer’s throughput increase are central to Solana’s institutional pitch and could enhance long-term investor appeal .
What are the main downside risks to monitor?
Broken long-term supports and double-top patterns increase correction risk. AI models suggest potential 20% drops toward ~$128, while macro shocks or upgrade delays could make dips deeper .
Is now a good time to accumulate SOL?
It depends. For those confident in Solana’s fundamentals and upgrades, accumulating in the $100–$120 corridor might be attractive. But if market sentiment weakens or technical signals worsen, caution is advised.
What key level signals bullish confidence return?
Sustained movement above ~$135–$140, especially crossing the 50-day MA, may signal renewed momentum and a shift toward accumulation from institutional players .
In summary, keeping an eye on support zones, moving average behavior, upgrade milestones, and ETF flows will be critical in gauging Solana’s next chapter.


Leave a comment